Smoke Contributes to Inaccurate Forecasts
This month’s epic fires in the western United States have been among the worst ever. As of this writing, they’ve burned close to 7 million acres, killed almost 40 people, and contributed to unhealthy air and greatly reduced visibility in many western cities.
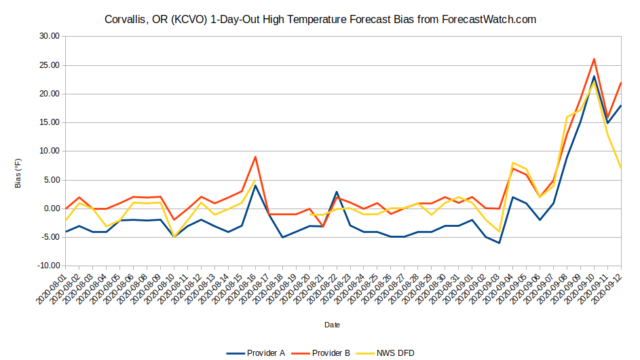
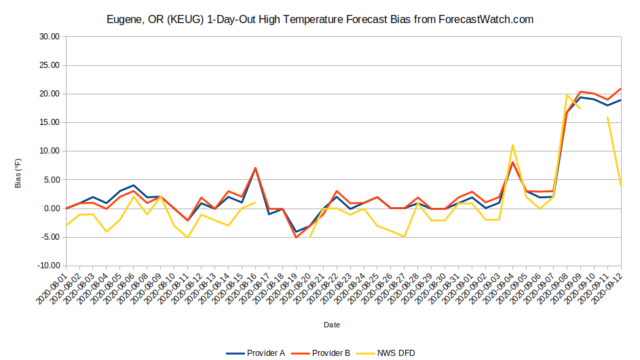
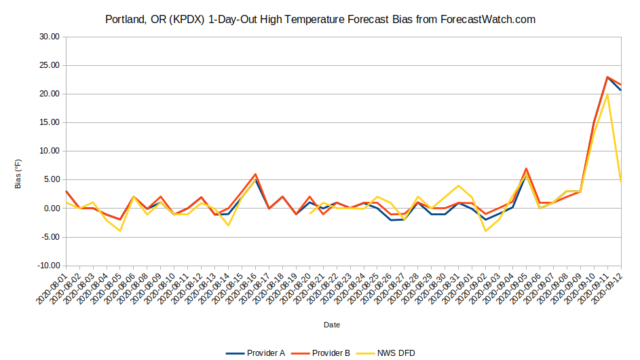
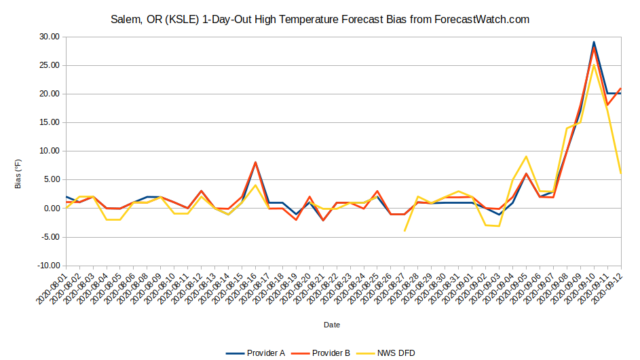
These fires have had other consequences as well. The massive amount of smoke they’ve created has caused automated high temperature forecasts to be wildly inaccurate for some west coast cities.
This phenomenon was noted by Cliff Mass, professor of Atmospheric Sciences at the University of Washington, in a recent blog. Mass explained that smoke isn’t currently built into forecast models, so it didn’t account for the smoke layer that caused lower amounts of solar heating — and therefore lower high temperatures. He further explained that forecasts made by the National Weather Service (NWS) were more accurate because of human intervention to an otherwise automated forecast.
Just how far off were the forecast high temperatures? We took a look at one-day-out high temperature forecasts for select cities in Oregon and compared them to actual high temperatures to support Mass’s anecdotal evidence. We selected two commercial weather forecast providers at random as well as forecasts from the NWS National Digital Forecast Database (NDFD) feed.
The graphs below depict the forecast bias. A positive bias occurs when forecast temperatures are higher than observed temperatures; conversely, a negative bias happens when observed temperatures were higher than forecast. We selected four cities that were greatly impacted by the smoke layers (Corvallis, Eugene, Portland, and Salem) and one city that was less impacted (Hoquiam).
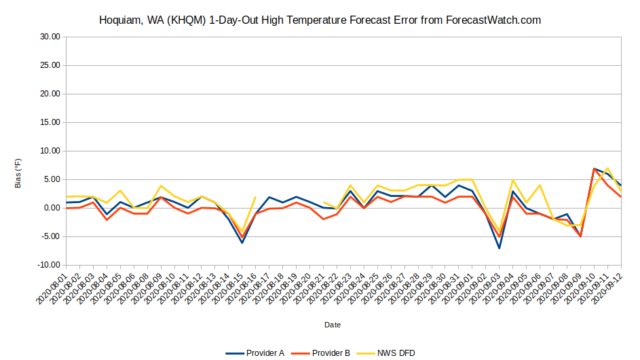
Several conclusions can be drawn from this analysis:
- All high temperature forecasts, regardless of the source, had a positive bias (an “over” forecast) from September 8 forward as the smoke layer became very deep. Some forecasts had a whopping 20°F+ bias!
- There is some evidence suggesting that the NWS, unlike other weather forecast providers, begin factoring in the smoke layer beginning on September 12. This caused the difference in forecast accuracy between the NWS and commercial weather forecast providers to be unusually high.
Note: The data is incomplete in some cases (such as September 10-11 for Eugene) because of data issues for the NWS NDFD. This is a continuing problem with the NWS NDFD, creating difficulties in making comparisons.
The increasing occurrence of such “black swans,” unpredictable events such as the western fires that impact local forecasts, causes questions in how we assess forecast performance. Where should corrections be made in the forecast process? And in an era of increasing automation, what is the role of quality control and when is it appropriate for human forecasters to intervene in the process?
Do you have thoughts on the role of human intervention in such an automated process? If so, please leave them in the comment section below.

One comment
Rob Dale
September 23, 2020 at 1:14 pm
I’m not sure annually-occurring fires meet the definition of a “black swan.”
In any event, I suggest meteorologists take a look at the HRRR Smoke model for help. It wasn’t an issue in the midwest where we could take a few degrees off the top.
Comments are closed.