After another anomalous summer across the United States, particularly across the West, we here at ForecastWatch took a look at how summer temperatures have been changing over the years in 18 cities across the United States at least one from each Census Division in the 50 U.S. states plus Puerto Rico. The cities we looked at were Fairbanks, AK, Honolulu, HI, Portland, OR, Los Angeles, CA, Phoenix, AZ, Denver, CO, Kansas City, MO, Minneapolis, MN, Dallas, TX, Nashville, TN, Chicago, IL, Columbus, OH, Portland, ME, New York, NY, Washington, DC, Charlotte, NC, Miami, FL, and San Juan, PR. We then fitted the best linear regression line through the temperatures for all cities since observations began in each location. The first year of observations ranged from 1869 (New York) to 1944 (Los Angeles).
While a linear regression line is not the best way to look at changing temperatures, particularly if changes may be more in a sinusoidal or polynomial fashion, an exponential change, or if very early years or very late summers may be anomalously hot or cool even for the average at that time, it is a quick and still reasonable way to look at temperature changes assuming that they change linearly amongst all cities. For the purpose of our quick analysis, we defined summer as June 21 through September 22, from the summer solstice to the autumn equinox. It’s important to note that because this is a 94-day period each year, even one summer is enough to average out any changes in weather patterns for that given summer.
We found that over all years of record, Phoenix showed the greatest temperature increase with a linear slope of 0.0621, meaning that assuming a linear temperature trend since observations began there in 1895*, the average summer temperatures have increased 0.621 degrees F every 10 years, or a total of about 7.9 degrees F since 1895. A very close second was Portland, Oregon, where temperatures were found to have a linear regression increase of 0.618 degrees every 10 years. This equates to an average summer temperature increase of 5.0 degrees F since records began there in 1941. None of the other 16 cities showed a linear increase in temperatures over 0.367 degrees F every 10 years (San Juan, PR).
Only one city showed a decrease in summer temperatures since their records began: Kansas City, which recorded a linear regression of -0.028 degrees F every 10 years. In other words, their average summer temperatures have remained fairly steady since records there began in 1888, with only an average decrease of 0.4 degrees F since 1888. Columbus, OH and Nashville, TN showed fairly small increases in summer temperatures, with Columbus exhibiting an increase of only 0.048 degrees F every 10 years and Nashville an increase of 0.099 degrees F every 10 years.
However, varying rates of warming (or cooling) in different periods of time between 1869 (when New York’s records began) and 1944 (when Los Angeles’s records began) could affect comparisons between cities, especially when looking at linear regression. So looking at linear changes in average summer temperatures only since 1944 when all 18 cities have observations Phoenix still comes out on top, but this time with a relatively significant increase in temperatures of 0.888 degrees F every 10 years. Thus in the last 78 years, since 1944, Phoenix’s average summer temperatures have warmed by 6.93 degrees F. Portland remains in second with an average increase of 5.27 degrees F since 1944, and Fairbanks is third with an increase of 3.64 degrees F since 1944. San Juan, Portland, ME and Washington, DC also have seen increases between 3.2 and 3.6 degrees F. Most of the remaining cities have seen average summer temperature increases between 1 and 3 degrees F since 1944. The exceptions on the lower end are Chicago (a 0.09 degree F temperature decrease since 1944) and Kansas City (a 1.95 degree F temperature decrease since 1944).
So what may cause differences in these average temperature changes over time? One thought may be differences in moisture content: the West, including the Pacific Northwest, is much drier then the Eastern U.S. in summer, and the drier air is easier to heat. Because of the extended large drought in the Western U.S., this is a theory about why recent years have been able to heat more quickly in the West with extended periods of upper-level ridging in the atmosphere. It has been shown that the West is warming more quickly than anywhere else in the U.S. and potentially even the world. This could explain why Phoenix and Portland are seeing by far the quickest warming of the cities analyzed here, and some of the cities in the more humid Midwest/Southeast such as Kansas City, Chicago, Columbus, Nashville, and Charlotte are seeing some of the slowest. However, even if true, it wouldn’t explain all the differences, as humid places (with consistently moderate to high dew points) such as Honolulu and San Juan are also warming more quickly than others on the list.
The following graph shows annual summer temperatures and linear trendlines for four cities that exhibit the greatest increases (Phoenix, Portland, OR, Fairbanks, and San Juan) and four that exhibit either decreases or the smallest increases (Chicago, Columbus, Kansas City, and Charlotte).
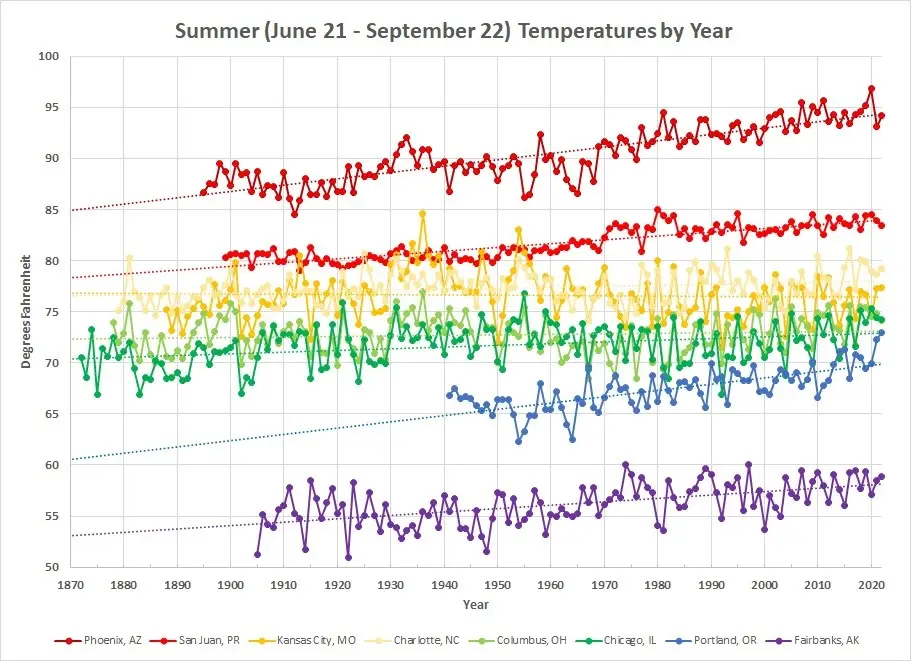
The dark red and red colors are Phoenix and San Juan, respectively, while the blue and violet colors are Portland, OR and Fairbanks, respectively. These four cities showed the largest linear increasing trend in temperatures. The orange, yellow and green colors showed the smallest increases or slight decreases: light orange is Charlotte, the darker gold is Kansas City, the light green is Columbus, and the dark green is Chicago. Interestingly, those that have the highest and lowest temperatures exhibit the greatest increases (though that’s not universally the case; Portland, ME and Dallas were generally on par temperature-wise with Portland, OR and San Juan, respectively, but did not exhibit as large of increases).
Phoenix’s average summer temperatures, which were in the upper 80s most of the time before 1930, now hover in the mid 90s. San Juan’s has increased from around 80 to the mid 80s. Portland, OR has seen average summer temperatures increase from the mid 60s to the low 70s. This increase is perhaps the most important seen on this graph simply because in the mid-20th century, temperatures below room temperature allowed for not as much cooling during the day and more frequent cooling at night, particularly from onshore flow from the Pacific Ocean. Thus, a vast majority of homes in the region were built without air conditioning, not thinking they would be needed. In more recent years, a large accelerated increase is seen to temperatures near room temperature with low temperatures only seen briefly early in the morning means that for most of the day, indoor temperatures heat up above tolerable room temperatures. Without air conditioning in most homes and less natural cooling from onshore flow, combined with the increase in population and crime rates in the region (which increase the need to keep windows closed and locked at night), the region’s view of no air conditioning needed” due to the mild climate in the mid 20th century is beginning to backfire. Every other city on this graph has widespread air conditioning except for Fairbanks but its summer temperatures are still far below the threshold of room temperatures. Fortunately, many new homes in the Pacific Northwest are now being built with air conditioning, but it remains a problem with homes and particularly apartments already built in years past. Of course, more air conditioning also equates to more greenhouse gases emitted into the atmosphere and thus the potential for even hotter temperatures, so there’s that.
When evaluating the temperatures of Portland, OR with those of Los Angeles (not shown on the graph), it is seen that Portland’s was lower than Los Angeles in the mid-20th century every single year from 1944 to 1986 saw hotter summer temperatures in Los Angeles. In many recent years, contrarily, Portland’s summer temperatures are now starting to exceed those of Los Angeles, which is much further south. Nearly half of the summers since 2002, including the past three, have been hotter in Portland than in Los Angeles.
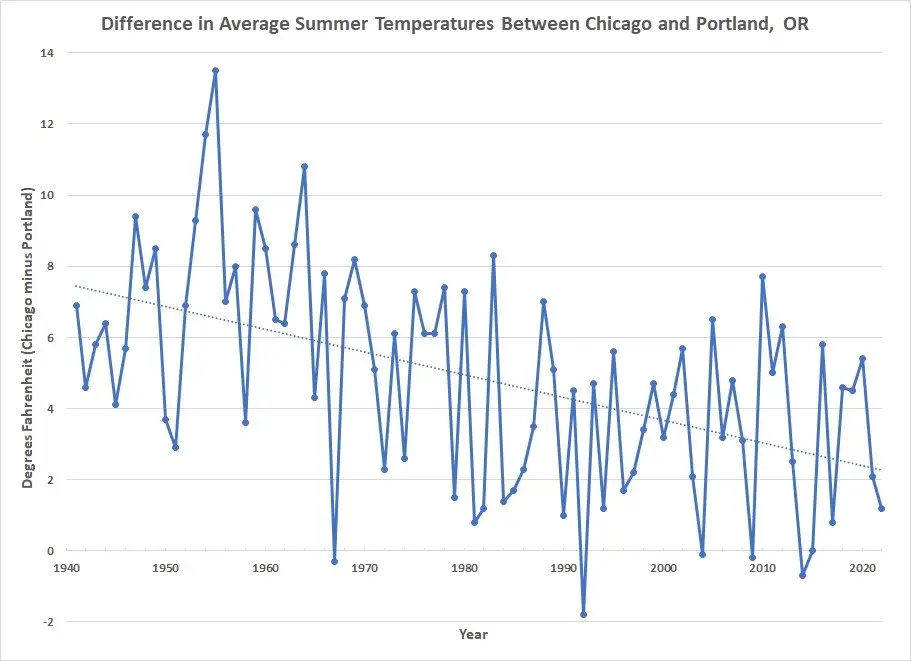
In fact, in recent years, the average summer temperatures in Portland (dark blue on the graph) are beginning to approach the average summer temperatures in the Midwest and interior Southeast cities on the graph (Chicago, Columbus, Kansas City, and Charlotte). This comes as a result of the rapidly increasing summer temperatures in Portland and the much smaller to even slightly decreasing summer temperatures in the Midwest and interior Southeast. In the mid 20th century, there was a much greater difference between these Midwest/Southeast cities and Portland, OR than there was between those same cities and San Juan. Recently, there’s very little difference between those Midwest/Southeast cities and Portland, OR. It should be noted, of course, that humidity is higher in the Midwest/Southeast than in the Northwest, so heat indices can be higher, but on the coin’s flip side, the dry air (recently exacerbated by summers becoming even drier) allows average high temperatures to often soar to greater heights in the Pacific Northwest, especially in recent years, than in the Midwest, which also has more clouds and thunderstorms in the summer to help control temperatures.
This analysis generally matches results of others from Climate Central and NOAA’s difference between 30-year normal maximum summer temperature datasets.
ForecastWatch analyzes accuracy of wind and temperature forecasts that can have impacts on energy demand and supply. Our data offers the ability to request customizable collections by location, time period, and forecast parameters, such as wind and temperature and have them conveniently delivered as easy-to-use CSV files. Contact us for more information.
