In November 2022, ForecastWatch took a look at linear trends in summer temperatures in the United States. Now we’ll take a look at linear trends in winter temperatures across the United States after a rather warm winter in the eastern United States, particularly in the Southeast.
We looked at the same 18 cities we analyzed for summer temperatures last year: Fairbanks, Alaska; Honolulu, Hawaii; Portland, Oregon; Los Angeles, California; Phoenix, Arizona; Denver, Colorado; Kansas City, Missouri; Minneapolis, Minnesota; Dallas, Texas; Nashville, Tennessee; Chicago, Illinois; Columbus, Ohio; Portland, Maine; New York, New York; Washington, District of Columbia; Charlotte, North Carolina; Miami, Florida; and San Juan, Puerto Rico. As with that analysis, we applied a best-fit linear regression line through the temperatures for all cities since observations began in these locations, but for the winter season this time. The observations began in 1869 (New York) to 1944 (Los Angeles).
In this analysis, we defined the winter season as December 21 through March 19 essentially from the average winter solstice to the average spring equinox. This is an 89- or 90-day period each year (depending on whether it was a leap year), which comprises enough days to average cold and warm periods each winter.
As with summers, Phoenix exhibited the greatest winter temperature increase with a linear slope of 0.0477. This means that assuming a linear temperature trend since observations began there for the winter of 1895-96 (128 winters), the average winter temperatures have increased 0.477 degrees Fahrenheit (F) every 10 years, or a total of about 6.1 degrees F since 1895-96. Los Angeles was close in second with an increase of 0.457 degrees F every 10 years, which is a temperature increase of about 3.6 degrees F since records began there in 1944-45. Washington, New York, San Juan, Minneapolis, and Portland, Oregon also saw linear trends of between +0.3 and +0.4 degrees F per 10 years, while Fairbanks, Miami, and Honolulu saw linear increases between 0.2 and 0.3 degrees F per 10 years. The other 8 cities in our analysis all saw average increases, but at a rate of less than 0.1 degrees F per 10 years. Kansas City, which showed a decrease in summer temperatures, also saw the lowest increase in winter temperatures of only 0.04 degrees F per 10 years.
As with the previous analysis, we also looked at linear temperature trends since a fixed winter of 1944- 45, when the latest observations for these 18 cities began (Los Angeles), to try to standardize the time period and account for the differences that could have occurred before 1944 in other cities. Doing this also indicated that Phoenix warmed the fastest at a rate of 0.853 degrees F every 10 years, almost as high as its rate of summer heating during that same time period that we found in our summer analysis. This means that Phoenix’s winter temperatures have warmed by 6.74 degrees F, using a linear trend, since 1944 (the summers have become 6.93 degrees F hotter from our November 2022 analysis). The winters in Fairbanks have seen a linear trend of 5.41 degrees F warming since 1944, while Minneapolis’s warming trend since then was 5.32 degrees F. Portland, Maine’s warming trend was 4.48 degrees F, and all but two of the other cities in our analysis have seen winters since 1944 warming between 1 and 4 degrees F. The two cities that have warmed the least since then are Kansas City (0.57 degrees F) and Denver (0.48 degrees F).
Interestingly, some of the cities that have warmed the least since 1944 have seen more warming in recent years, while some of those that have warmed the most since 1944 saw much of that warming earlier in that period. For example, if we look at temperature trends only since 1980, Nashville claims the highest trend increase with an average of 0.997 degrees F every 10 years – significantly more than its increase of 0.34 degrees F every 10 years since 1944. Miami, Washington, Charlotte, Dallas, Columbus, Chicago, and Portland, Maine, all also recorded warming trends of at least 0.79 degrees F per 10 years since 1980 all significantly more than their respective warming trends since 1944. These locations are all found in the eastern United States. On the other hand, Fairbanks, Denver, Los Angeles, Phoenix, and Portland, Oregon all western United States cities and some among the fastest-warming cities in winter since 1944 are the five cities with the slowest winter warming since 1980. In two cases Denver and Fairbanks, temperatures have actually decreased on average since 1980. Denver’s temperatures have trended 0.22 degrees F cooler every 10 years since 1980, while Fairbanks has seen a downward temperature trend of 0.59 degrees F every 10 years since 1980. Phoenix, Los Angeles, and Portland, Oregon all have seen only slow warming winter temperature trends of 0.14 degrees F or less every 10 years since 1980.
Looking even more recently since the winter of 1993-94 (this winter was selected as it encompasses the last 30 years, a threshold currently accepted to define a climatic period), it’s even more intriguing to see the contrast between the eastern and western United States: the 8 fastest warming cities in our analysis are all in the eastern United States: Washington, Nashville, Miami, Charlotte, New York, Columbus, Chicago, and Portland, Maine all of which are showing a temperature increase trend of at least 0.87 degrees F every 10 years since 1993-94. All but Chicago have shown a winter warming trend of at least 1.12 degrees F every 10 years. On the other hand, the 6 slowest warming (or cooling) cities are in the western United States: Fairbanks, Honolulu, Phoenix, Los Angeles, Denver, and Portland, Oregon. Denver and Portland have shown slight winter cooling trends in the last 30 years of -0.15 and -0.69 degrees F per 10 years, respectively. The other four cities in our analysis Dallas, Kansas City, Minneapolis, and San Juan are either in the middle of the country or not in the United States mainland (San Juan’s winter temperatures are already warm in the tropics so they don’t change much anyway).
It follows that combined with the summer temperatures warming the quickest in the western United States as outlined in the November 2022 blog, annual temperature variations, at least in the past 30 years or so, are likely increasing most in the western United States. and least in the eastern United States, although further analysis would help demonstrate this.
The following graph shows annual winter temperatures and linear trendlines for four cities that have exhibited the greatest increases (Phoenix, Minneapolis, Fairbanks, and New York) since observations began in those locations and four that exhibit the smallest increases (Charlotte, Chicago, Denver, and Kansas City).
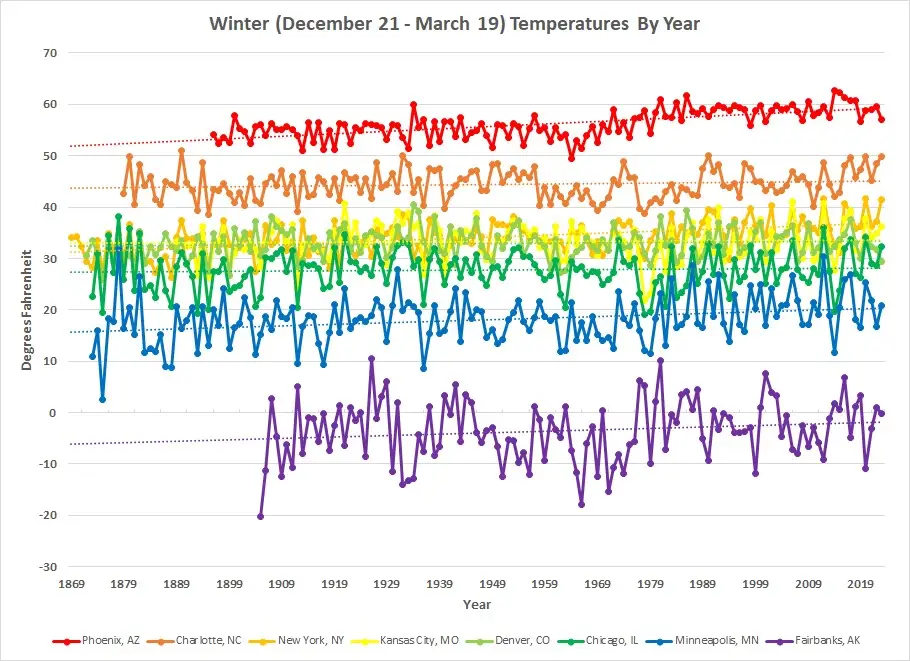
The four largest increases over their observation periods are Phoenix in red, New York in orange, Minneapolis in blue, and Fairbanks in purple. Phoenix appeared to see much of its warming in the 1960s and 1970s and appears to have been fairly steady winter temperature-wise since 1980. Fairbanks also doesn’t show much increase since 1980 when looking at the graph. These are examples of two of the western United States cities that, although showing larger increases since observations began in the late 19th or early 20th centuries, haven’t shown much increase in recent years. On the other hand, Charlotte in orange, is one of the cities that hasn’t shown much of an increase in winter temperatures over its observation period but has shown more of an increase in recent years. Kansas City in yellow and Chicago in green are also similar.
This does beg an interesting research question, based on these data, about whether some larger weather pattern or teleconnection has been creating a faster winter warming trend over the past 30-45 years across the eastern United States despite slower warming trends dating back to the late 19th to mid 20th centuries in these areas compared to the western United States. Of course, those trends could also be influenced by simple things such as more recent winters being warmer than normal in the eastern United States and cooler in the western United States due to La Niña. One distinct possibility is the Pacific Decadal Oscillation, which has been negative most of the time since the late 1990s after being positive most of the time in the 1980s and 1990s. This oscillation, when negative, typically leads to warmer temperatures in the eastern United States and cooler temperatures in the western United States, mostly during winter, as cooler temperatures reign off the west coast of the United States. If this is the cause, the trend in winter temperatures would slow again in the eastern United States and rise again in the western United States when this oscillation becomes positive or neutral again.
Finally, a question arises when looking at temperature trends about the effects of urbanization. While fully addressing this issue would require extensive research, some research as been done in the past and different sources have found that about half of warming my be due to urban heat islands. However, some other research as found that urban stations placed in cooler locations such as parks may be warming more slowly than rural stations paced in warmer areas, so this helps to illustrate while answering this question may be fairly complicated. It is possible that some of this higher observed warming, especially in the winters, may be due to increased urbanization in areas such as Phoenix, but we also have to look at where the weather stations are placed. either way, the greater the urbanization, the more people are exposed to the warmer temperatures regardless of the exact causes.
ForecastWatch analyzes accuracy of wind and temperature forecasts that can have impacts on energy demand and supply. Our data offers the ability to request customizable collections by location, time period, and forecast parameters, such as wind and temperature and have them conveniently delivered as easy-to-use CSV files. Contact us for more information.
