ForecastWatch has been the world’s premier weather forecast monitoring and assessment company since 2003. Since then, we’ve collected over 2.5 billion weather forecasts from dozens of providers to evaluate and compare accuracy. We are beginning to expand our services and in-depth analyses beyond the 1-14 day weather forecast to now include seasonal outlooks.
For fall 2025, we collected forecast temperature and precipitation maps from four major providers for the time period of September, October, and November. The Weather Channel’s forecast (top left) was issued on August 14, 2025. AccuWeather’s forecast (top right) was issued on August 6, 2025. NOAA’s Climate Prediction Center’s forecast (bottom left) was issued on August 21, 2025. The Old Farmer’s Almanac issued their forecast (bottom right) on July 11, 2025.
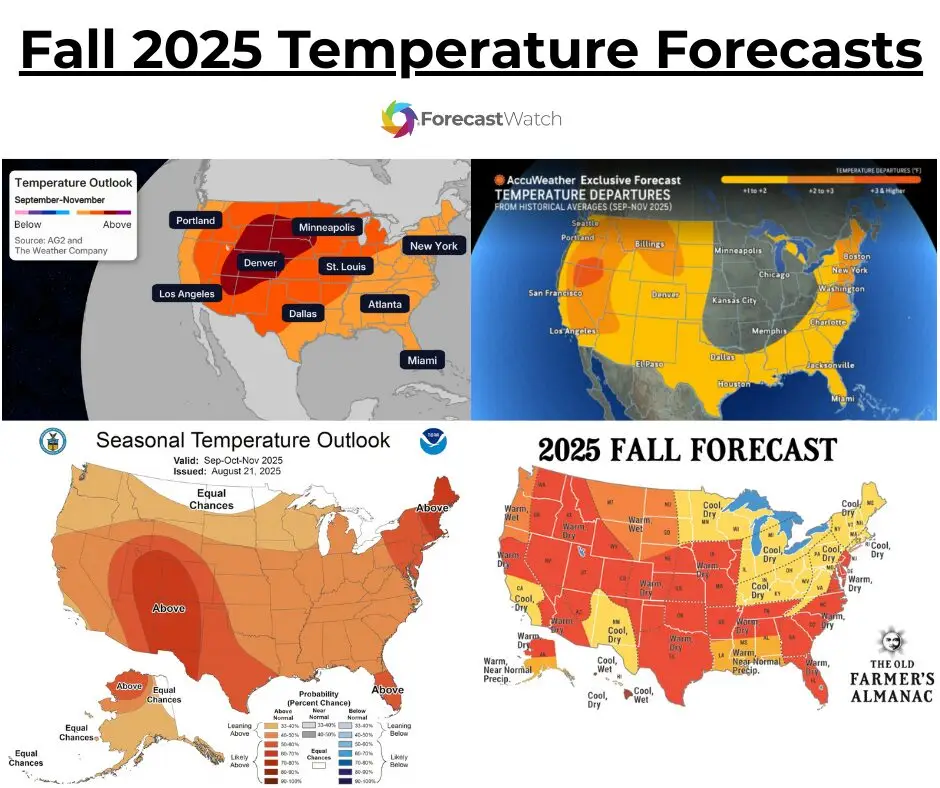
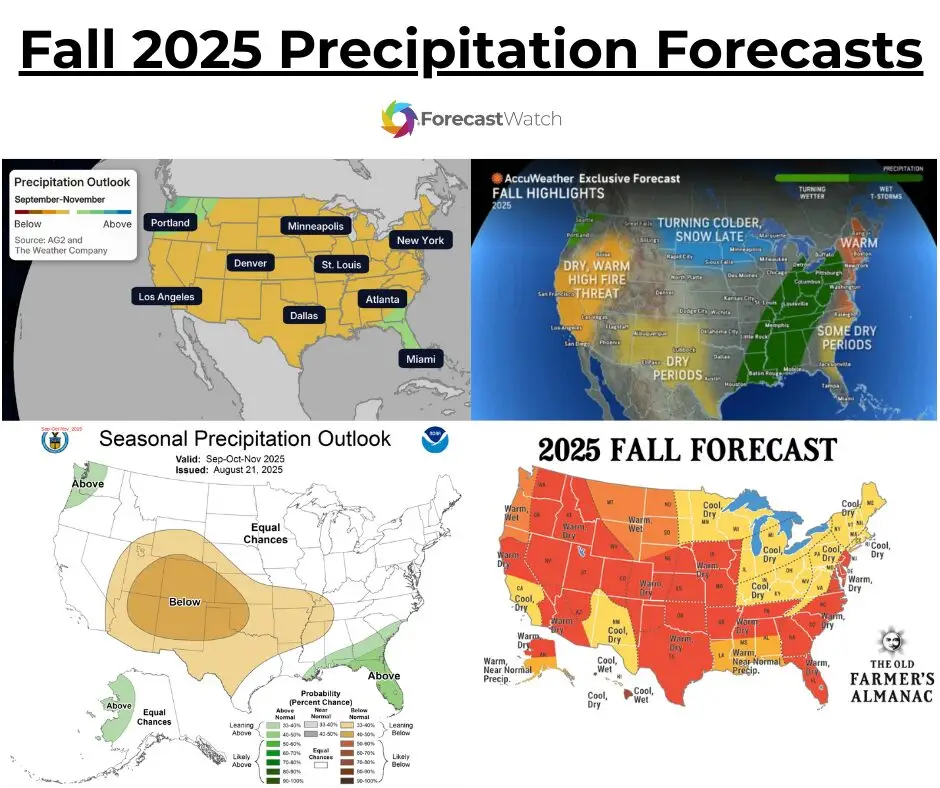
It is important to note that these four forecasts each differ slightly in the way they present their forecasts. NOAA uses a probabilistic forecast, providing contours using percent chance of above or below normal. Similar to NOAA, The Weather Channel uses contours of varying colors to show predictions of above and below normal, but without specific percentiles. The Old Farmer’s Almanac uses general verbiage such as cool” and wet” regionally to describe their forecast. AccuWeather uses a deterministic forecast approach for their temperature map and general verbiage for their precipitation forecast map.
Because of the differences in forecast map approaches, they cannot be directly compared. Unlike our 1-14 day weather forecast analyses, we do not have point data available for the seasonal forecasts, and cannot use actual statistical analysis to compare to actual observations. However, we thought it would be interesting to look at the forecast maps individually to see if their predictions were generally correct or not.
Overall, most of the providers in this analysis forecasted above normal temperatures for the majority of the continental United States. The biggest forecast agreement was above normal temperatures in the western United States. The precipitation forecasts differ between the providers, although they are all in agreement for drier conditions in the southwest United States around Texas, New Mexico, and Arizona.
So, what actually happened?
Fall 2025 ranked the third warmest fall in the 131-year record, with seven states setting fall temperature records. Nationwide, 275 counties, home to nearly 15 million people, experienced their warmest fall temperatures on record. The fall season ranked in the driest third on record across the continental United States, despite several counties in California and Arizona recording their wettest fall on record. The Southeast region recorded its driest fall since 1978.
The graphic below shows the fall 2025 temperature summary, with all maps and data collected from NCEI. September is shown in the top left, October in the top right, November in the bottom left, and all three months combined for the season in the bottom right. All of the maps depict seasonal temperature percentiles showing areas of above to below average.
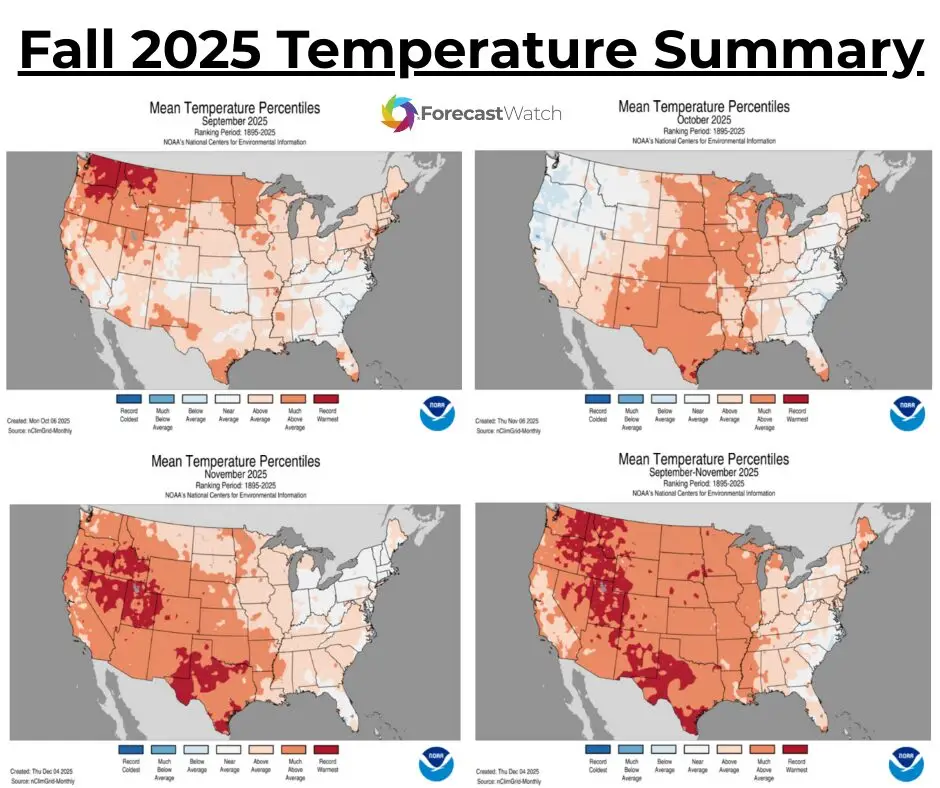
Temperature-wise, fall 2025 overall was above normal for most of the continental United States, despite an early November cold blast. Many areas in the western U.S. experienced their warmest fall ever. Near normal to slightly below normal temperatures were seen along the Carolina coast. Comparing the seasonal temperature map to the provider temperature forecast maps, the providers performed well in general.
NOAA’s forecast performed very well, nailing the forecast for likely above normal temperatures in the southern and western United States, as well as far northeast. The Weather Channel’s forecast did very well also. They forecasted above normal temperatures for the entire continental U.S., and above normal temperatures were observed almost everywhere.
AccuWeather had the only deterministic forecast, forecasting anywhere from one to three degrees Fahrenheit above normal for the western half of the U.S., the south, and the east coast. Although the seasonal summary map above does not include actual temperatures, AccuWeather was correct in predicting that temperatures would be above average in those areas. Their map does not show any forecast temperature predictions for much of the Midwest and eastern Plains, which saw above normal temperatures as well. The Old Farmer’s Almanac’s forecast was spot on for warmer temperatures in the western and central U.S. However, it predicted cooler temperatures in much of the Midwest and Northeast, where above average temperatures were still felt, just not to the degree of the western U.S..
The next graphic below shows the fall 2025 precipitation summary, with all maps and data again from NCEI. September is shown in the top left, October in the top right, November in the bottom left, and all three months combined for the season in the bottom right. All of the maps depict seasonal precipitation percentiles showing areas of above to below average.
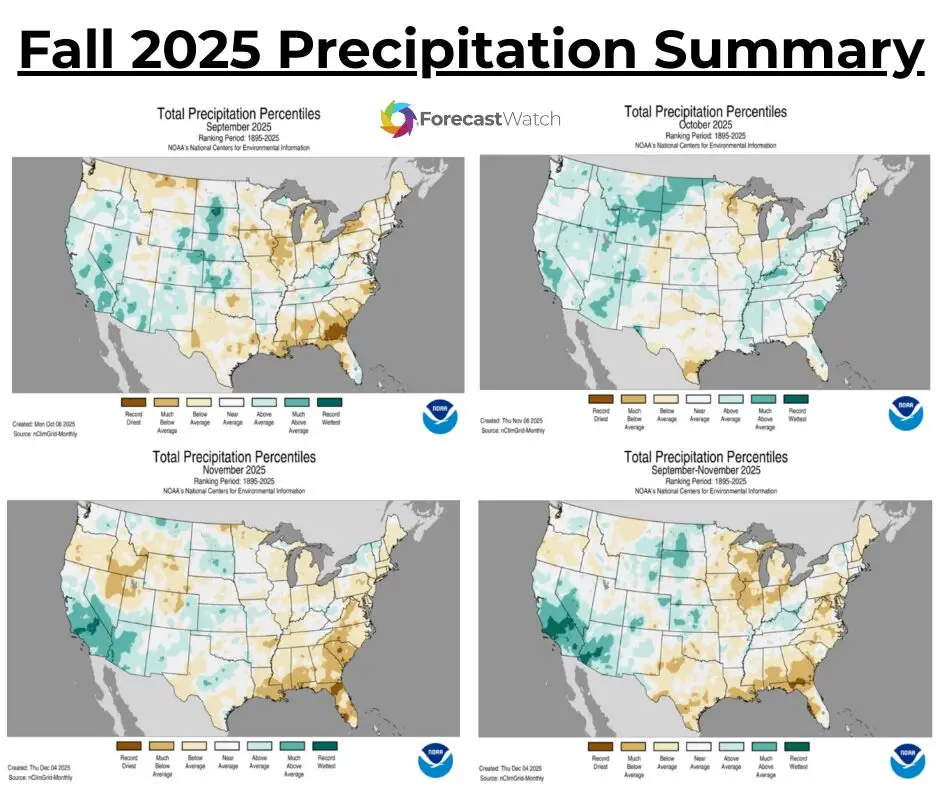
Precipitation-wise, fall 2025 had distinct areas of above and below average. The southwest, including California, Nevada, Arizona, southern Utah, and portions of New Mexico saw above normal precipitation to record wettest for the season. Many areas of the Plains saw above normal precipitation as well, as did much of Kentucky. Much of the southern United States, the East Coast, and the Midwest/Great Lakes experienced below average precipitation, with record dry areas in Florida. Comparing the seasonal precipitation map to the provider precipitation forecast maps was a bit more difficult than temperatures.
NOAA’s forecast was almost the opposite of what actually occurred. They predicted above normal precipitation for most of the Pacific Northwest and Florida, and both regions saw near normal to below normal precipitation, and record precipitation in Florida. NOAA also predicted below average precipitation in the Four Corners region and surrounding areas, which actually saw closer to normal and above normal precipitation. Similarly, The Weather Channel’s forecast had above normal precipitation in the far Northwest and in Florida, which ended up being near to below average. They predicted below normal precipitation for the rest of the United States, which was more accurate for the eastern half of the United States versus the western half that was wetter.
AccuWeather did not publicly provide a specific precipitation forecast map for fall 2025, but shared a map that highlighted a few areas of concern. They predicted that California and Nevada would be dry, and that area ended up with much above average precipitation. AccuWeather accurately noted the chance for dry conditions in portions of Texas and Florida. They outlined a large area from Louisiana through New York for wet and stormy conditions, which for the most part did not pan out, with the exception of Kentucky that leaned above normal. The Old Farmer’s Almanac predicted dry conditions for much of the Southwest, which actually experienced record precipitation. It did correctly forecast near to below average precipitation for the Gulf Coast and East Coast, as well as the Midwest. The two areas deemed wet” were in the Pacific Northwest and northern Plains, which were fairly accurate.
One thing to keep in mind is that some weather forecast providers are better at predicting weather in specific regions, predicting one forecast metric than another, or predicting in the shorter range or longer range. This informal analysis is based on only the fall 2025 and may not accurately represent their forecasts and accuracies in other seasons or years. If you would like to see more evaluations like this, please let us know.
At ForecastWatch, our suite of solutions offers a variety of ways to better understand the value and quality of weather forecasts to meet the needs of meteorologists, corporate clients, and media partners. If you could benefit from our accuracy data and analysis, contact us today at info@forecastwatch.com.
