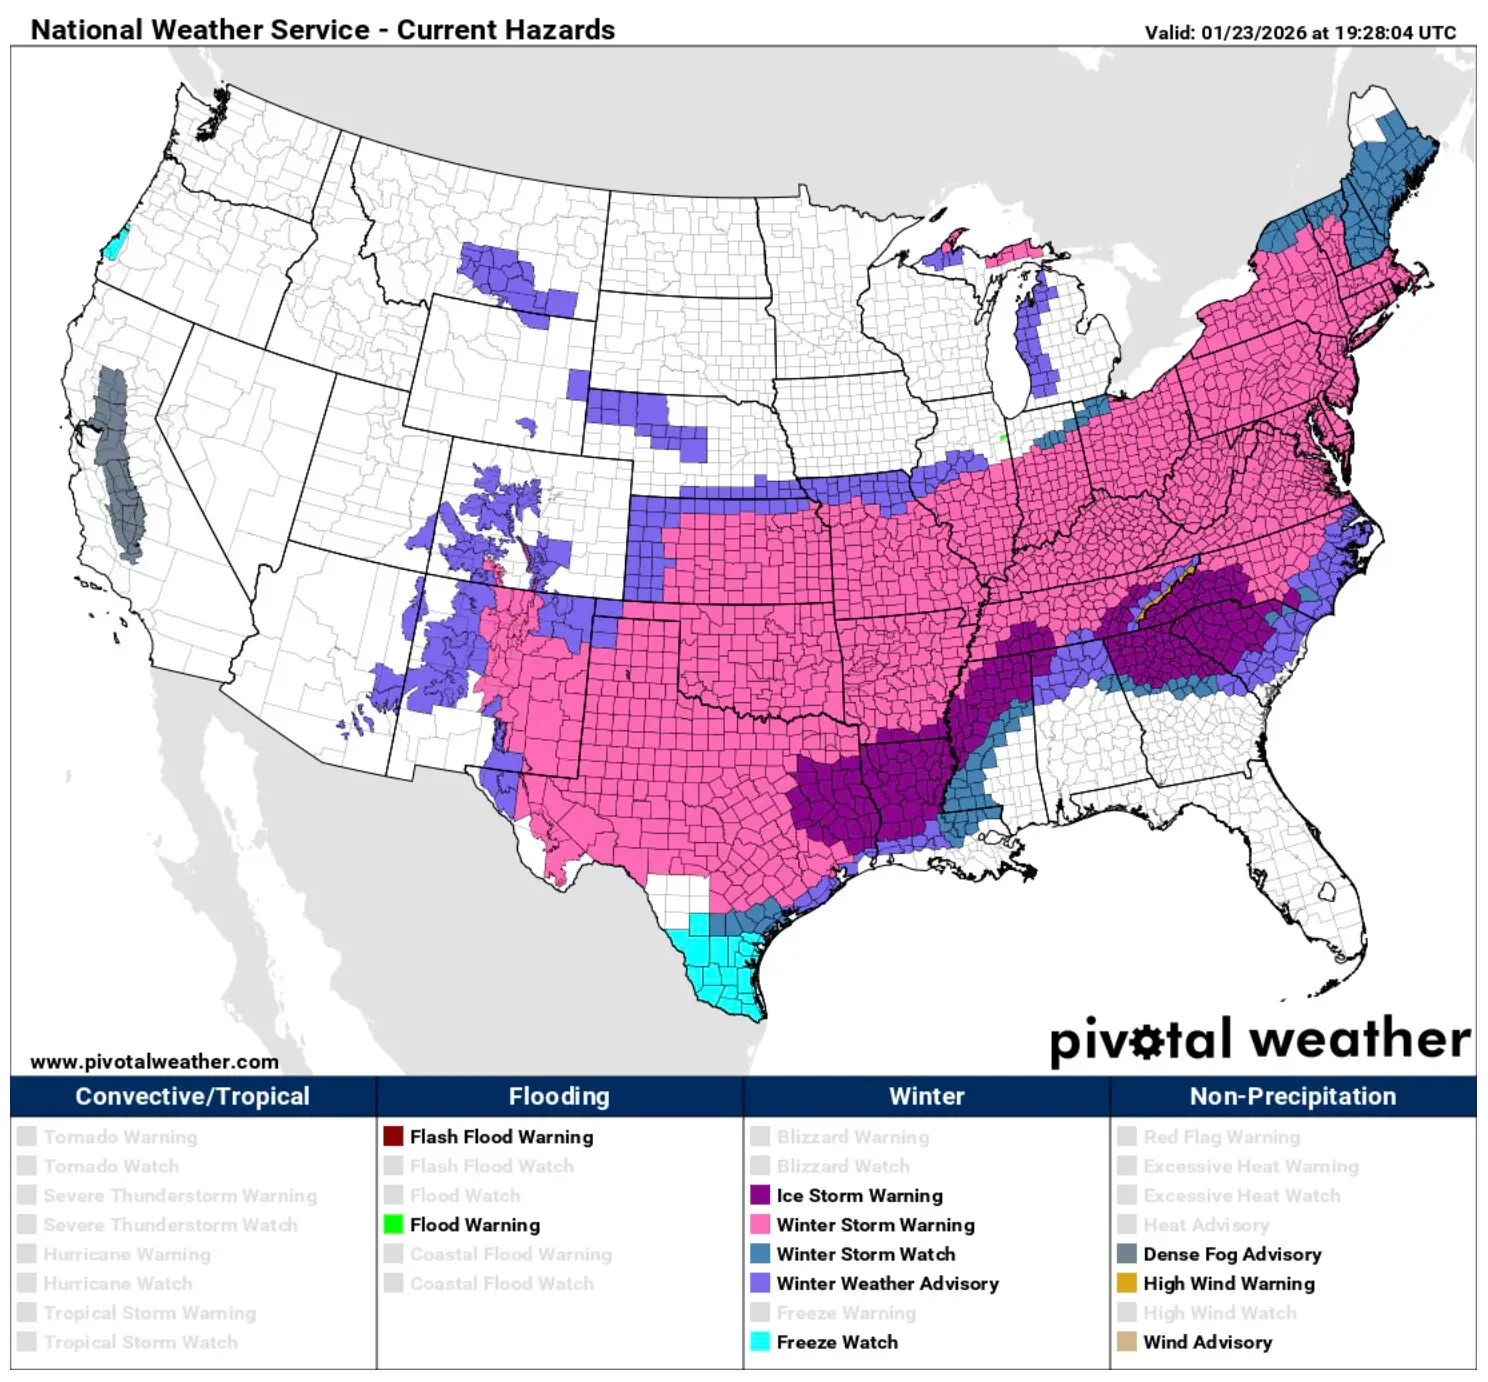
More than 240 million people across more than 40 states were in the path of a potentially historic winter storm that brought dangerous snow, ice, and bitterly cold conditions stretching over 2,300 miles across the United States from January 23-26, 2026.
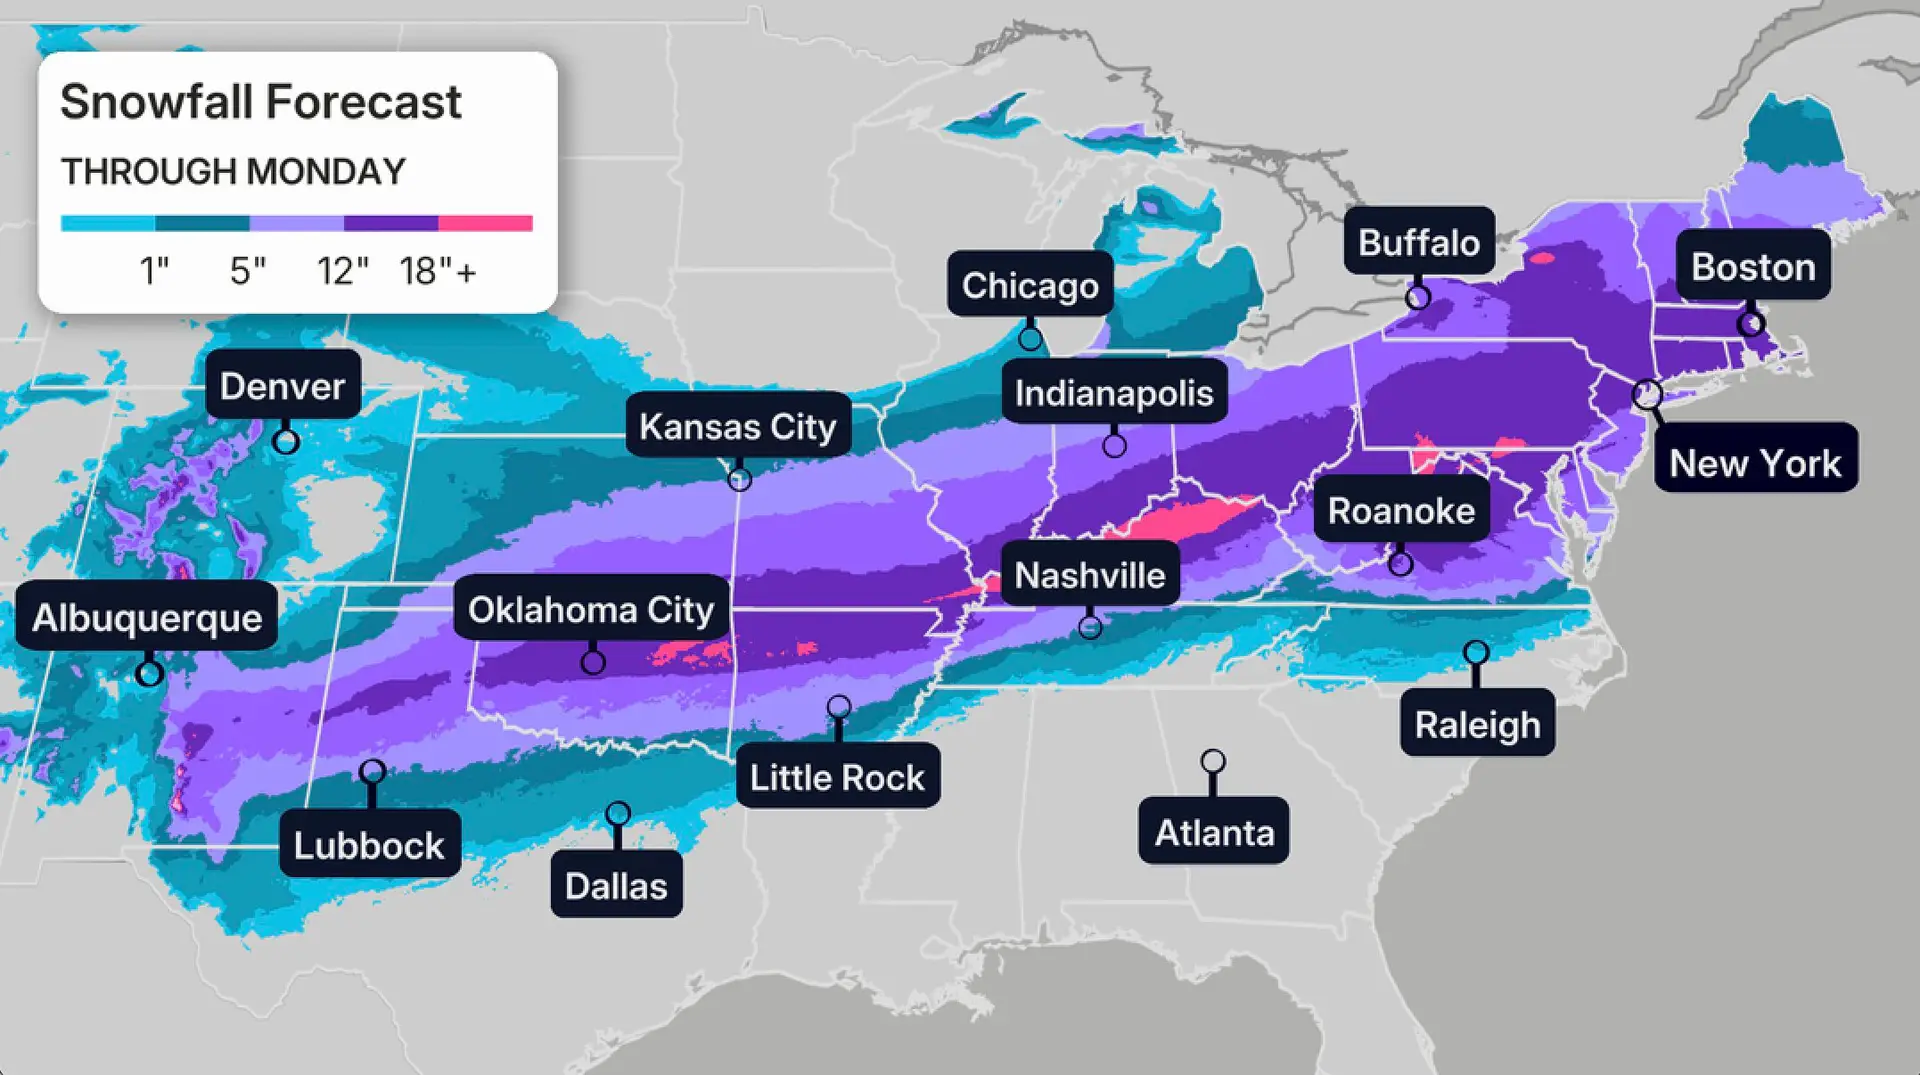
Ahead of one of the most expansive winter storms in recent history, major weather forecast providers made early calls for impactful winter weather several days in advance. Early on, weather models and forecasts suggested the heaviest swath of snow would fall from an area along Oklahoma, Arkansas, Kentucky/Tennessee, West Virginia, and Virginia. However, throughout the days leading up to the winter precipitation event, models and forecasts trended further north with the heavier snow.
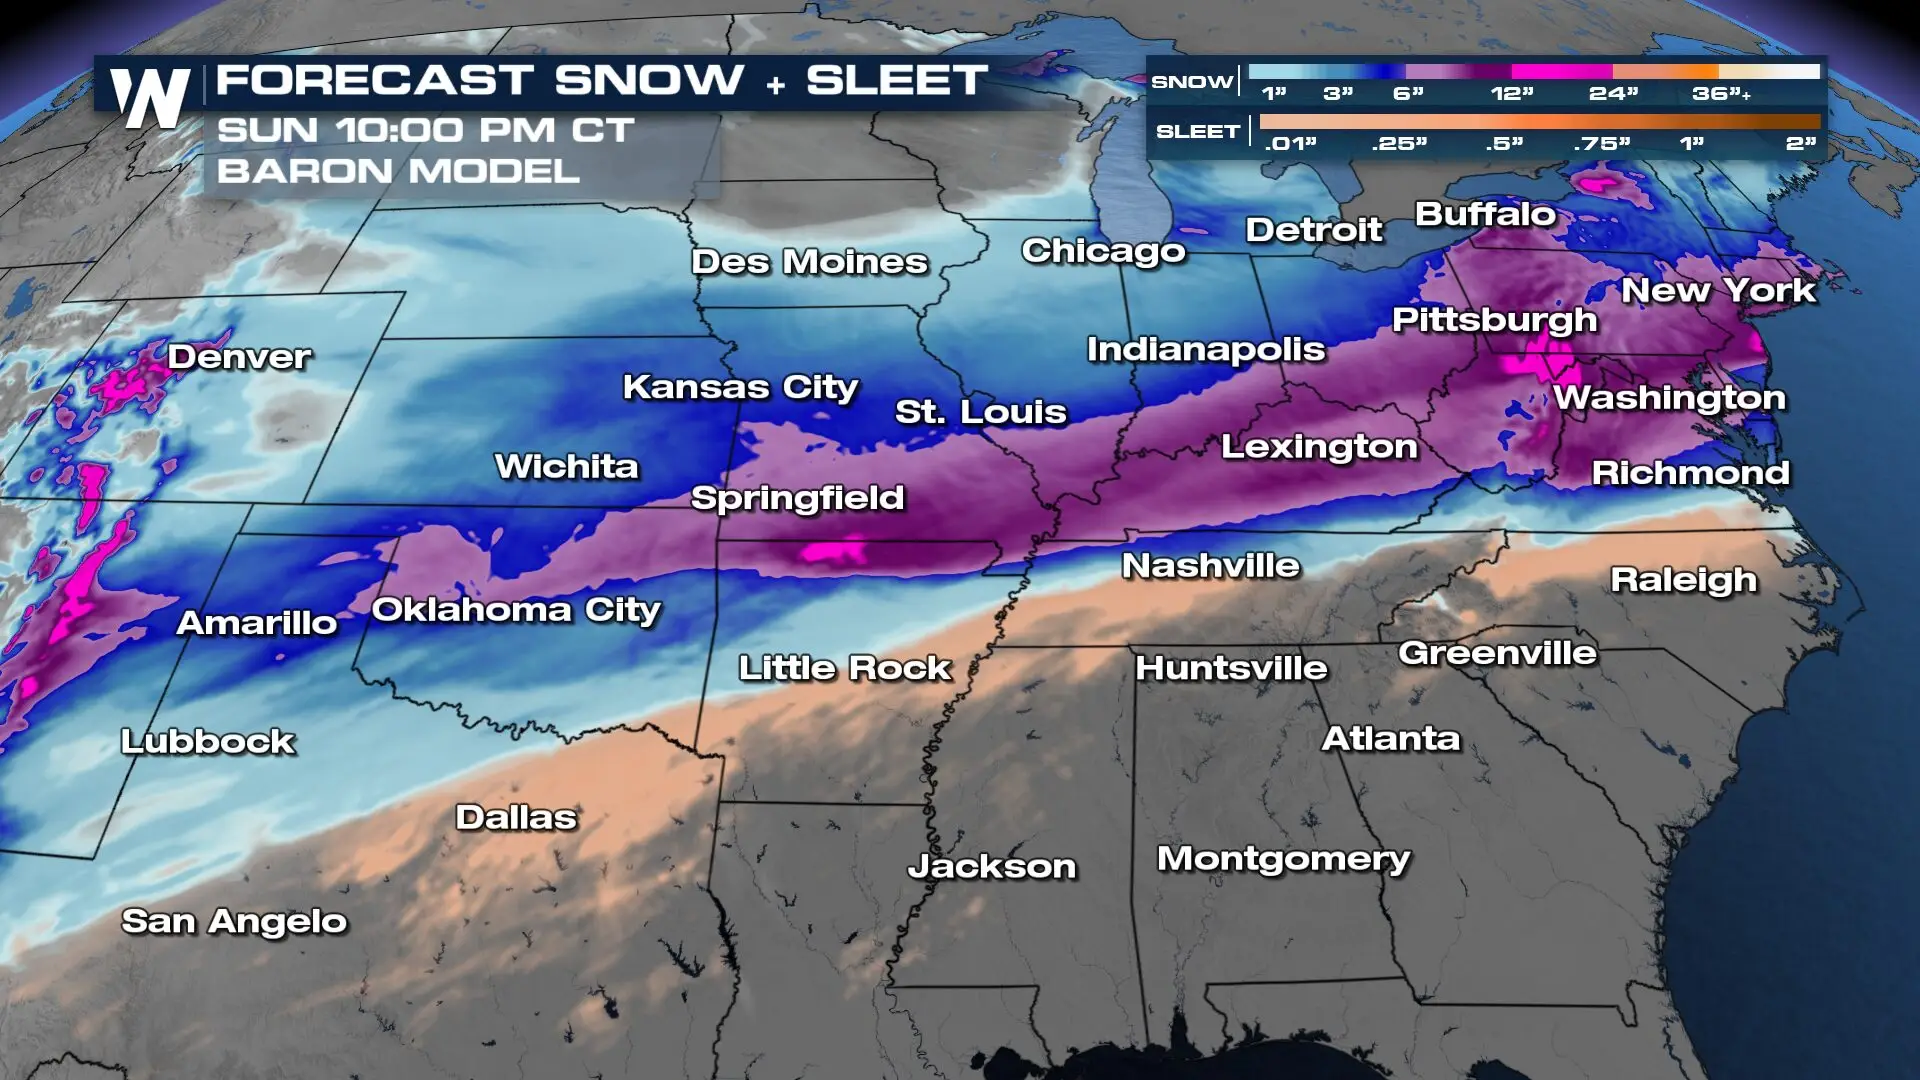
So, what actually happened? NOAA’s National Operational Hydrologic Remote Sensing Center (NOHRSC) uses snowfall observations from numerous observing networks including ASOS, COOP, CoCoRaHS, FAA, NWS spotters, and others to create a national gridded snowfall analysis. Below is the national snowfall observation data (top left), as well as a closer look at the Northeast (top right), central U.S. (bottom left), and Midwest/Ohio Valley (bottom right).
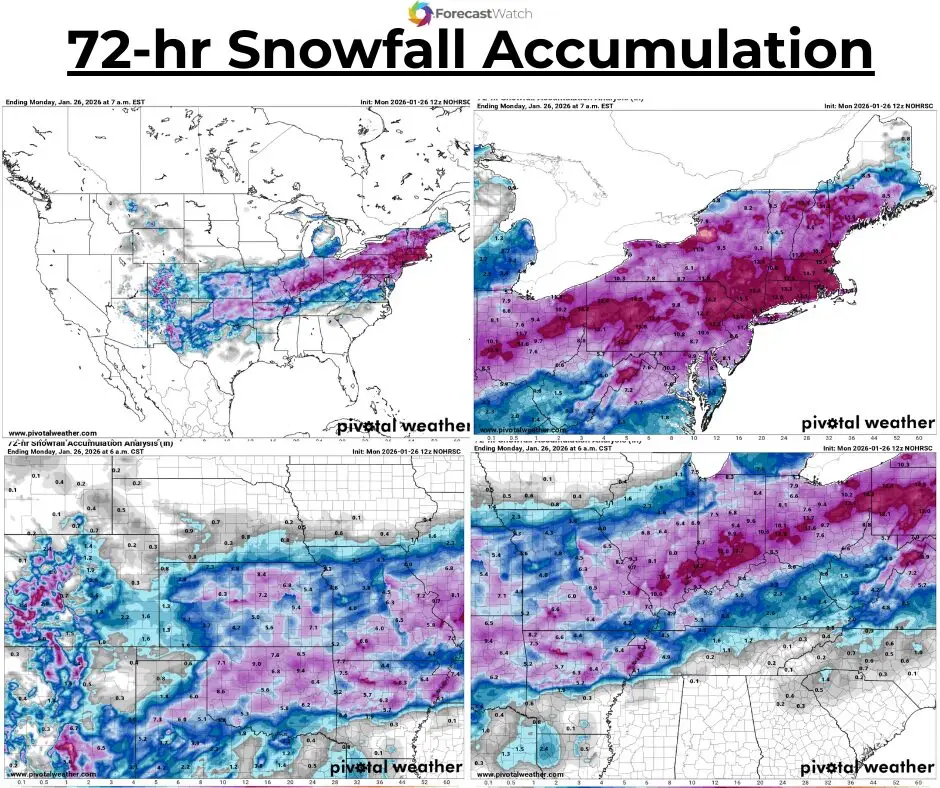
Looking at the national map, the heaviest swath of snowfall did fall north of where most forecast snow maps predicted. The heaviest snowfall was recorded along a path from eastern Missouri to Pennsylvania, to Massachusetts. Many areas along this path received 12-18+ inches of snow. We will go further in depth on each region below.
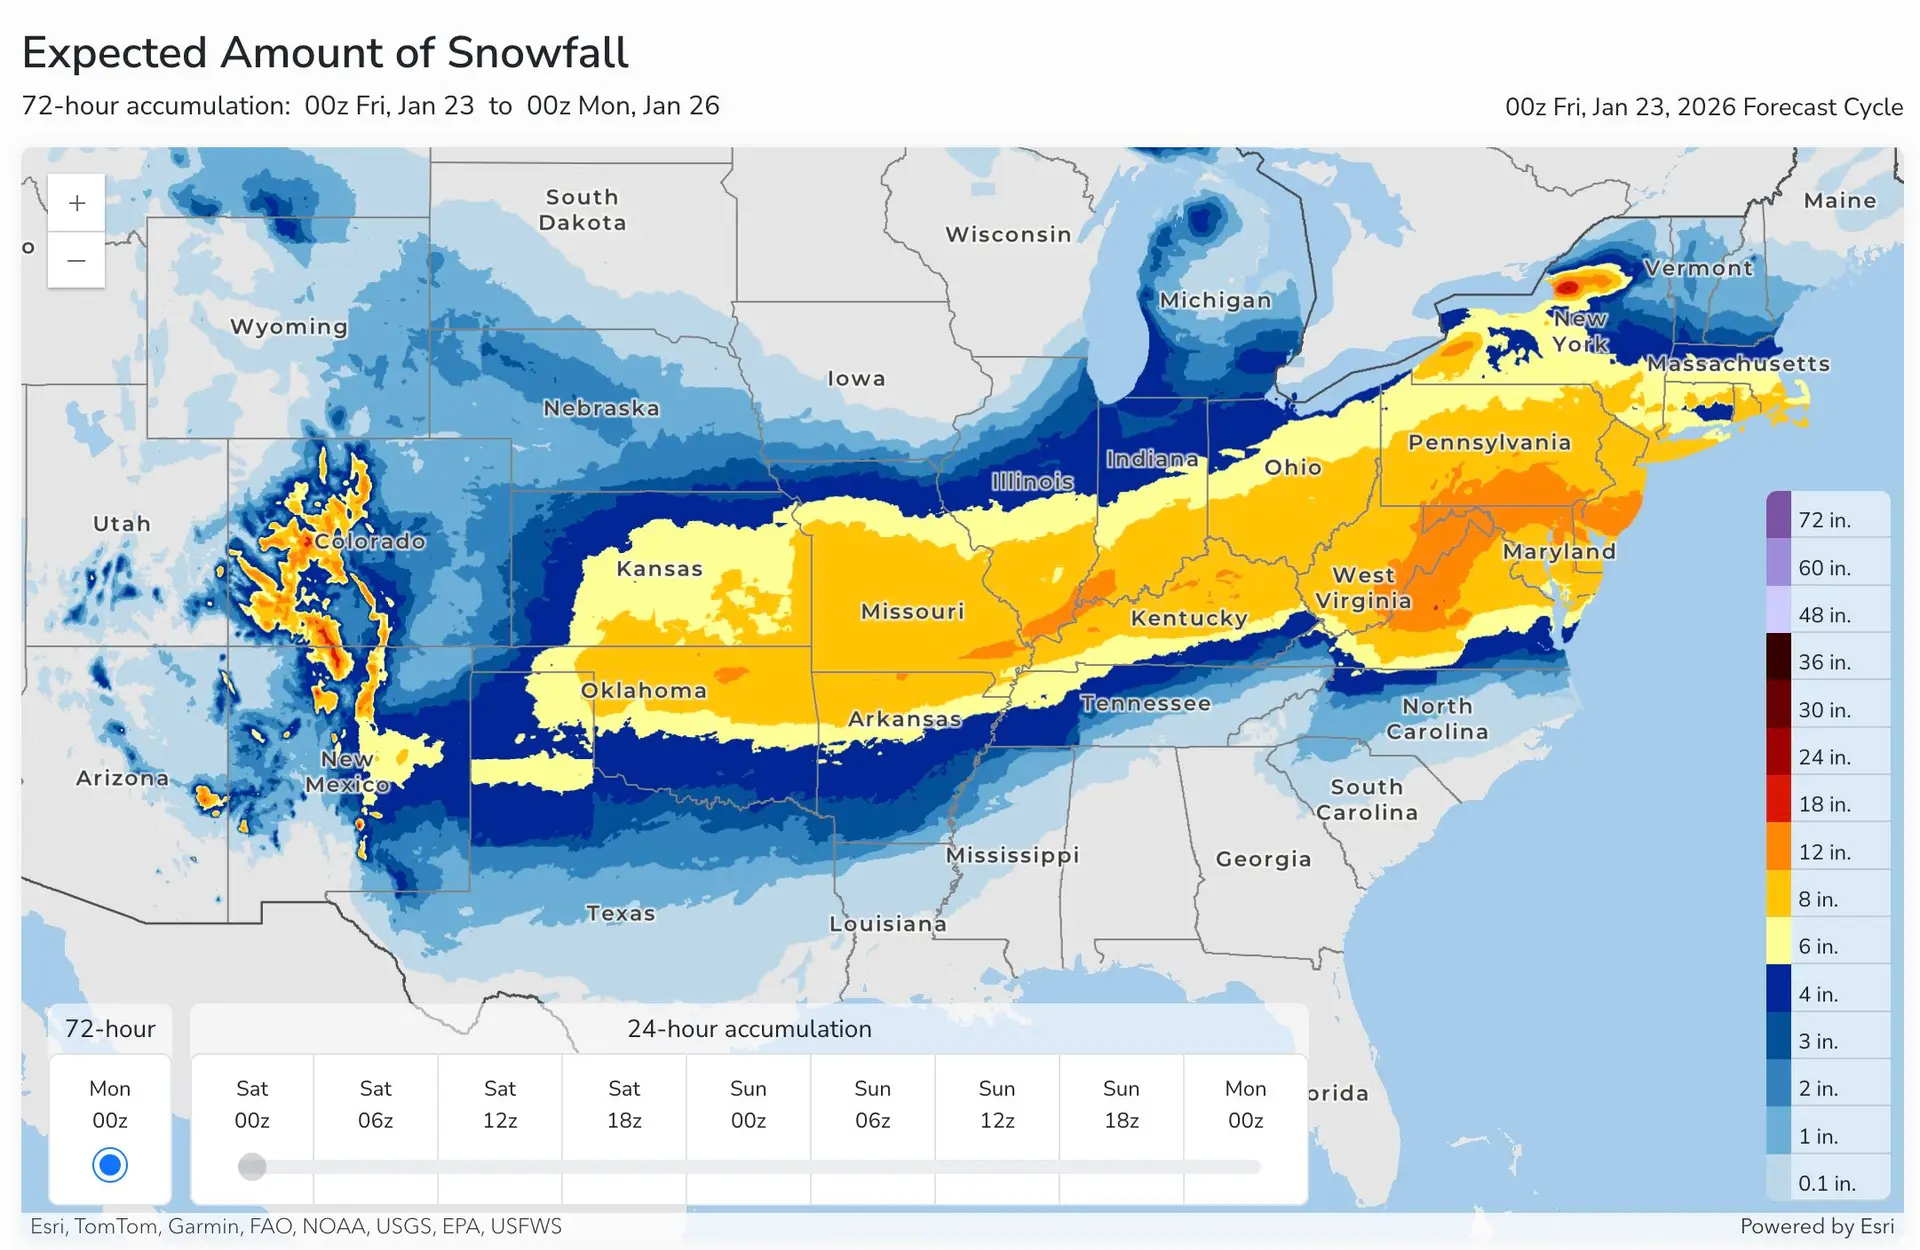
On Thursday, January 22, 2026, we collected snowfall forecasts from seven major weather forecast providers in the United States. These forecasts were made about 24 hours in advance of the snow and ice beginning in the central U.S., and about 48 hours in advance of the snow and ice starting to hit the Midwest and move out toward the East Coast. We chose this time frame to collect forecasts from because 24-48 hours in advance can be a crucial decision-making time for the public and businesses alike. Therefore, we thought it would be insightful to compare these forecasts to what actually happened, and see where providers nailed the forecast and where they could have performed better. It is important to note that the providers analyzed in this blog may have made adjustments to their forecasts after this time period.
TL;DR: The table below provides a general overview of each of the providers analyzed and areas where their forecasts were generally correct, incorrect, or a mix of both.
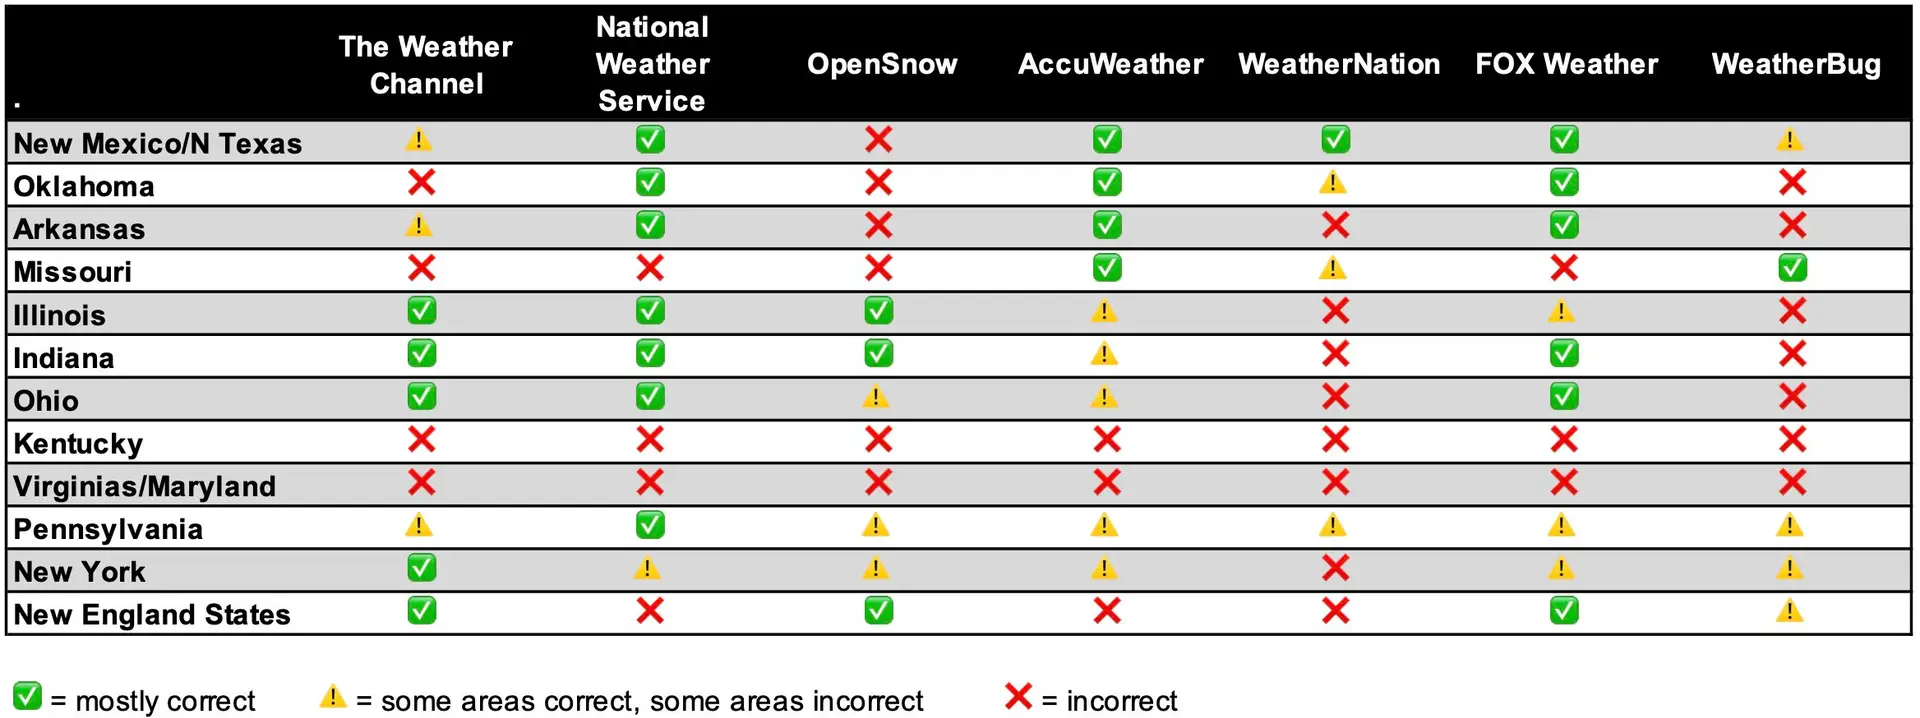
The rest of this blog analyzes each forecast individually for various regions of the United States.
The Weather Channel (TWC):
National: The Weather Channel’s forecast predicted the heaviest snow (18+”) to fall in portions of eastern Oklahoma, northern Arkansas, Kentucky, and Maryland. However, snow totals in these areas were significantly less. The heaviest snow ended up falling north of these areas for the most part.
Central U.S.: The Weather Channel’s forecast called for generally 5-12” of snow in the Texas panhandle and eastcentral New Mexico, with higher totals possible in the Sacramento Mountains and the Amarillo-Lubbock area. Ultimately, the mountainous areas in New Mexico did receive a large snowfall of over a foot, with lower totals surrounding. The Texas panhandle only received a narrow area of 6-8” of snow with a sharp cutoff in totals for surrounding areas. TWC predicted a large area of 12-18” of snow for the northern half of Oklahoma, excluding the panhandle, with the potential for 18+” in northeastern Oklahoma. A swath of similar predicted totals continued through southern Missouri and northern Arkansas. Snowfall observations show that these areas generally received 6-10” of snow, while a couple small areas in northern Arkansas received over a foot of snow.
Midwest: TWC’s forecast for the Midwest included a large area of 18+ inches of snow through the northern half of Kentucky, with totals cutting off sharply on the southern extent. However, there were no observations over 18” in the Midwest, and Kentucky saw generally less than 5” of snow. They called for an area of 12-18” of snow through southern Illinois, southern Indiana, and southern Ohio, with an area of 5-12” of snow forecast for southern Illinois, most of Indiana, and most of Ohio. Generally, this forecast performed well. The 12-18” predictions did come to fruition in portions of southern Illinois, southern Indiana, and central Ohio as numerous reports of 12-15” of snow were received.
Northeast: TWC’s forecast for the eastern United States included a large area of 12-18” of snow from Pennsylvania, New York, northern New Jersey, Massachusetts, Connecticut, Rhode Island, and Maryland. There was a small area of 18+” snow forecasted near Williamstown, New York and along the Maryland/Pennsylvania border. Ultimately, there was a large area of 12-18” snow reports across the Northeast. A few reports over 18” were recorded in Massachusetts.
National Weather Service (NWS):
National: Looking at the big picture, the National Weather Service predicted a large swath of 8-12” of snow from Oklahoma through New Jersey. They highlighted a few areas that may receive 12-18+ inches of snowfall such as a small portion of northern Oklahoma, extreme southern Indiana and Illinois, and along the Appalachian Mountains in Virginia, West Virginia, and Maryland. The highest snow totals of this event did end up north of the heaviest snowfall predictions on this map.
Central U.S.: The NWS did fairly well with snowfall predictions in New Mexico and the Texas panhandle, with the exception of overestimating snow totals in the far northern Texas counties and the Oklahoma panhandle. The forecast for the remainder of Oklahoma performed well with 6-12” of snow general forecast for the northern half of the state, matching what fell. The forecast for Arkansas was also fairly accurate, with multiple areas receiving 6-12+” of snow. The NWS Midwest forecast struggled the most in Missouri, where they predicted a large area of 8-12” for the northern two-thirds of the state, and the potential for higher totals in the far south east. Ultimately, most of the state saw less than 7” of snow.
Midwest: The NWS forecast in the Midwest showed a large area of 6-12” of snow across the southern half of Illinois and Indiana, and the majority of Ohio. These forecasts performed very well overall. Some portions of far southern Illinois, southern Indiana, and central Ohio did receive reports of 12-15” of snow, just north of the areas where the NWS highlighted the potential for more than a foot of snow. The NWS did overestimate snow totals in Kentucky.
Northeast: The Northeast is where the National Weather Service struggled the most. They predicted a large area of 6-12” of snow across the Virginia’s, Pennsylvania, Maryland, New Jersey, Delaware and southern New York, with the potential for more than a foot of snow along the Appalachian Mountains in this region. The forecast panned out well for the areas right along the Appalachian Mountains, Pennsylvania, and New Jersey. However, snow totals were largely underestimated in northern New York, Massachusetts, Rhode Island, Connecticut, Vermont, New Hampshire, and southern Maine.
OpenSnow:
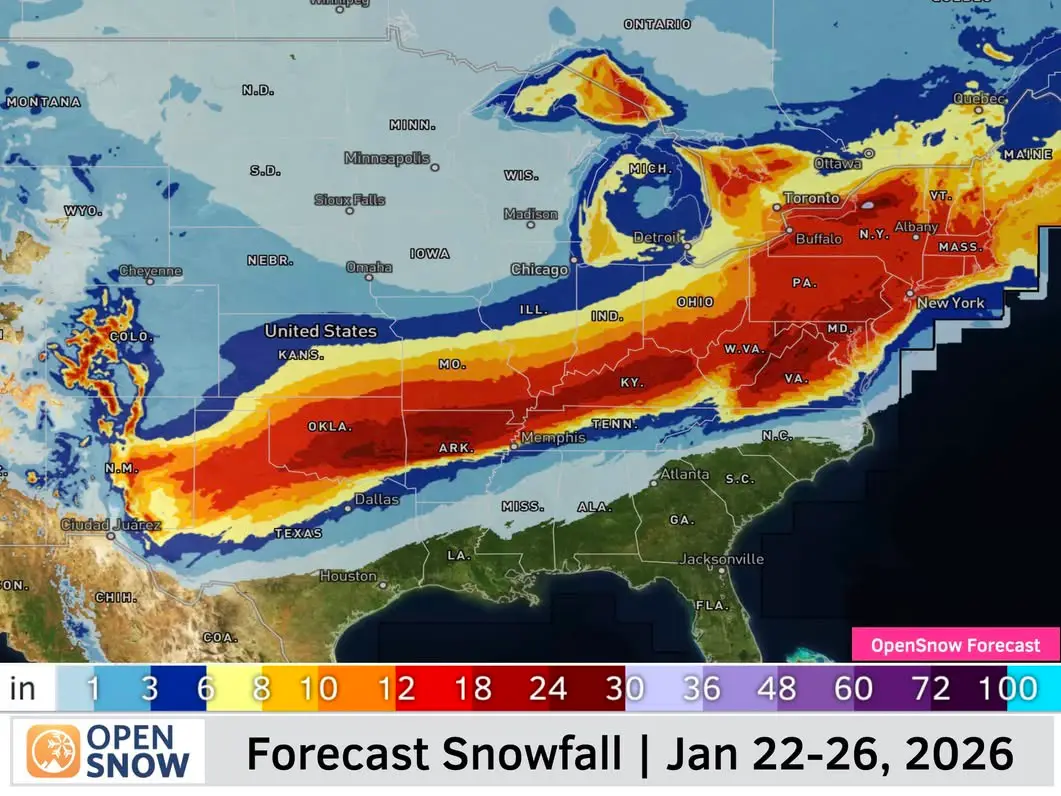
National: OpenSnow’s forecast snow map is slightly south and more aggressive than other maps collected at this time. They called for a foot of snow over a large area from northern Texas, through Kentucky, and up through the Northeast. They also forecasted multiple areas of 18-24+ inches of snow across southern Oklahoma, northern Arkansas, Kentucky, the Virginia’s, and southeastern Pennsylvania.
Central U.S.: OpenSnow’s forecast for the central United States was largely overestimated. In Texas, they forecasted over a foot of snow in the panhandle, where only a handful of counties received up to 7 inches, with sharp cutoffs in totals surrounding. Snow totals across portions of Oklahoma, northern Arkansas, and southern Missouri were more than a foot less than predicted.
Midwest: OpenSnow forecasted the heaviest swath of snow to fall in the heart of Kentucky, when in reality it fell across southern Illinois, southern Indiana, and central Ohio. In Kentucky, they predicted two feet or more of snow across much of the state, when reports indicate less than 5 inches of snow fell across most of the area. The forecast for Illinois generally performed well, as did Indiana, with the exception of slightly higher snow totals received in the northern portion of the state. Ohio’s forecast was decent, except for the 12-18” area predicted in southern Ohio. The areas that did receive a foot or more were north of the predicted area.
Northeast: In the Northeast, OpenSnow correctly predicted that numerous areas in Pennsylvania, southern New York, Connecticut, Rhode Island, Massachusetts, Vermont, and New Hampshire would receive more than a foot of snow. However, they did overestimate the snowfall in the Virginia’s, southern Pennsylvania, and Maryland, where they forecasted 18-24” of snow.
AccuWeather:
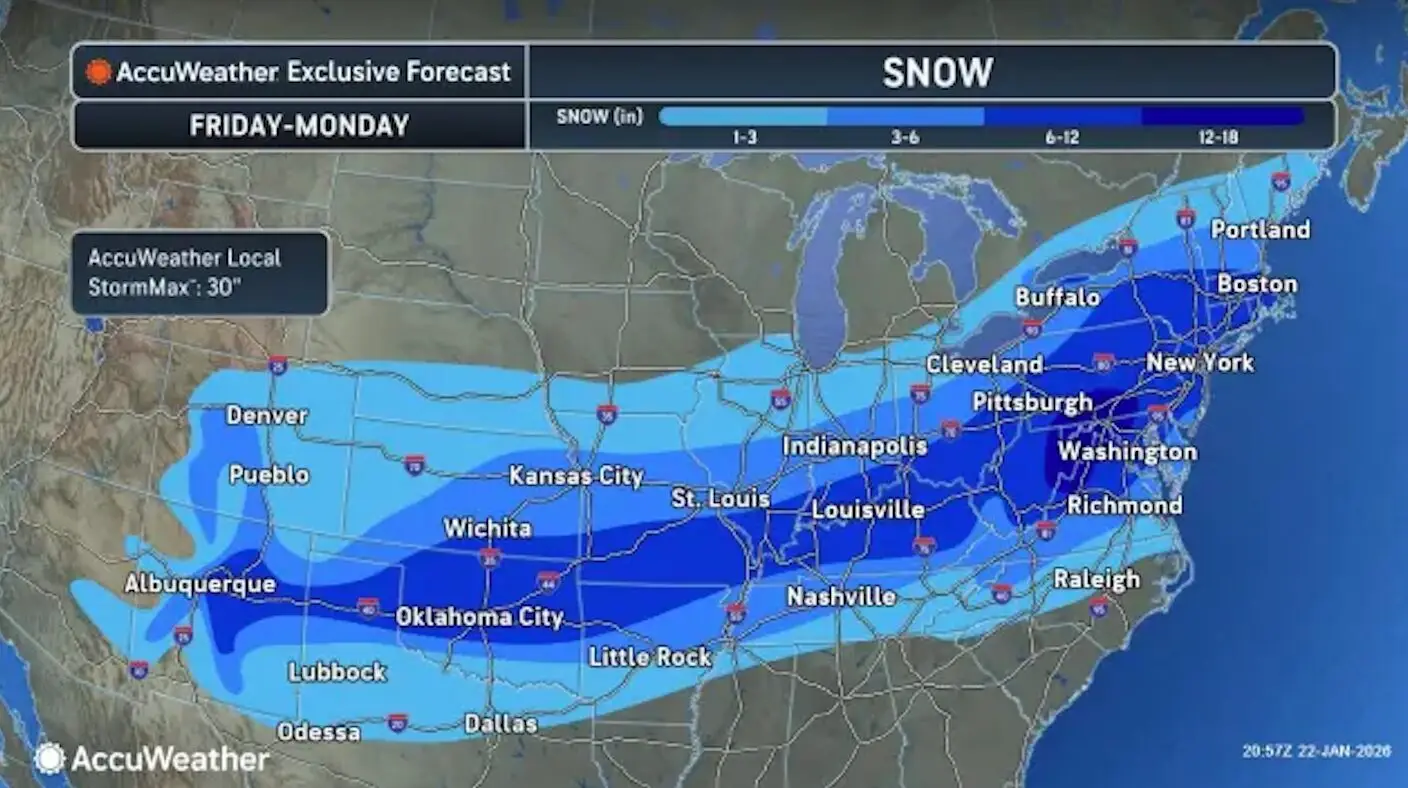
National: AccuWeather’s forecast snow map for the time period is similar to others in that the swath of the heaviest snowfall stretches from New Mexico to Massachusetts. However, they were less aggressive with their predictions compared to others, with the only area they were predicting to receive more than a foot being in the Virginia’s, western Maryland, and southern Pennsylvania.
Central U.S.: AccuWeather’s snow forecast was nearly spot on for New Mexico and northern Texas. It also accurately predicted snowfall totals in Oklahoma, northern Arkansas, and Missouri. Overall, AccuWeather’s forecast for this region performed very well.
Midwest: For the Midwest region, AccuWeather forecasted a swath of 6-12” of snow across southern Illinois, southern Indiana, southern Ohio, and the majority of Kentucky. To the north of that swath, an area of 3-6” was predicted for the region. The 6-12” regions performed very well, although there were some reports over a foot in the southern portions of Illinois, Indiana, and Ohio. AccuWeather’s 3-6” predictions for the Midwest were a little low compared to observations. Although AccuWeather forecasted 6-12” for most of Kentucky, much of the state saw less than 5 inches of snow.
Northeast: AccuWeather’s snow forecast showed 6-12” for most of the Northeast, with over a foot of snow possible on the border of West Virginia and Virginia, as well as western Maryland and southern Pennsylvania. AccuWeather’s forecast did underestimate snow totals in portions of Pennsylvania, southern New York, Massachusetts, Connecticut, Rhode Island, northern Vermont, northern New Hampshire, and southern Maine where 12-18” of snow was reported.
WeatherNation:
National: WeatherNation’s forecast snow map was more conservative overall than other providers. They, too, had a more southerly solution for the Midwest and Northeast.
Central U.S.: Generally, WeatherNation’s snow predictions for New Mexico and northern Texas were accurate. In Oklahoma, 6-10” snow totals were a little more widespread than what was predicted. The forecast for northern Arkansas included an area of 12+” of snow possible, but had a very sharp cutoff in totals on the southern edge of the system, missing the forecast in some areas. The forecast for Missouri panned out fairly well.
Midwest: For the Midwest, WeatherNation’s snowfall forecast was a little too far south. They forecasted 6-12” for southern Illinois, southern Indiana, and portions of Ohio. Many locations within those parameters received over a foot of snow. WeatherNation had a small area of 3-6” totals possible just to the north of the 6-12” area, with most of those areas receiving more than 6” of snow. Specifically, the forecasts for the northern half of Illinois and Indiana, and northwestern Ohio, underestimated the snow totals. On the other hand, snow totals were vastly overestimated throughout Kentucky. 6-12” of snow was predicted for the majority of the state, and less than 5” fell in most of the area.
Northeast: It is a little tough to decipher the forecast for the Northeast based on the map projection. Generally, 6-12” was forecasted for the Virginia’s, Maryland, and Pennsylvania, with higher totals possible in the mountainous areas. Numerous areas throughout Pennsylvania, southern New York, and northern New Jersey saw totals over a foot. Snow totals were largely underestimated for the New England states, where less than a foot of snow was predicted and a foot to a foot and a half of snow fell.
FOX Weather:
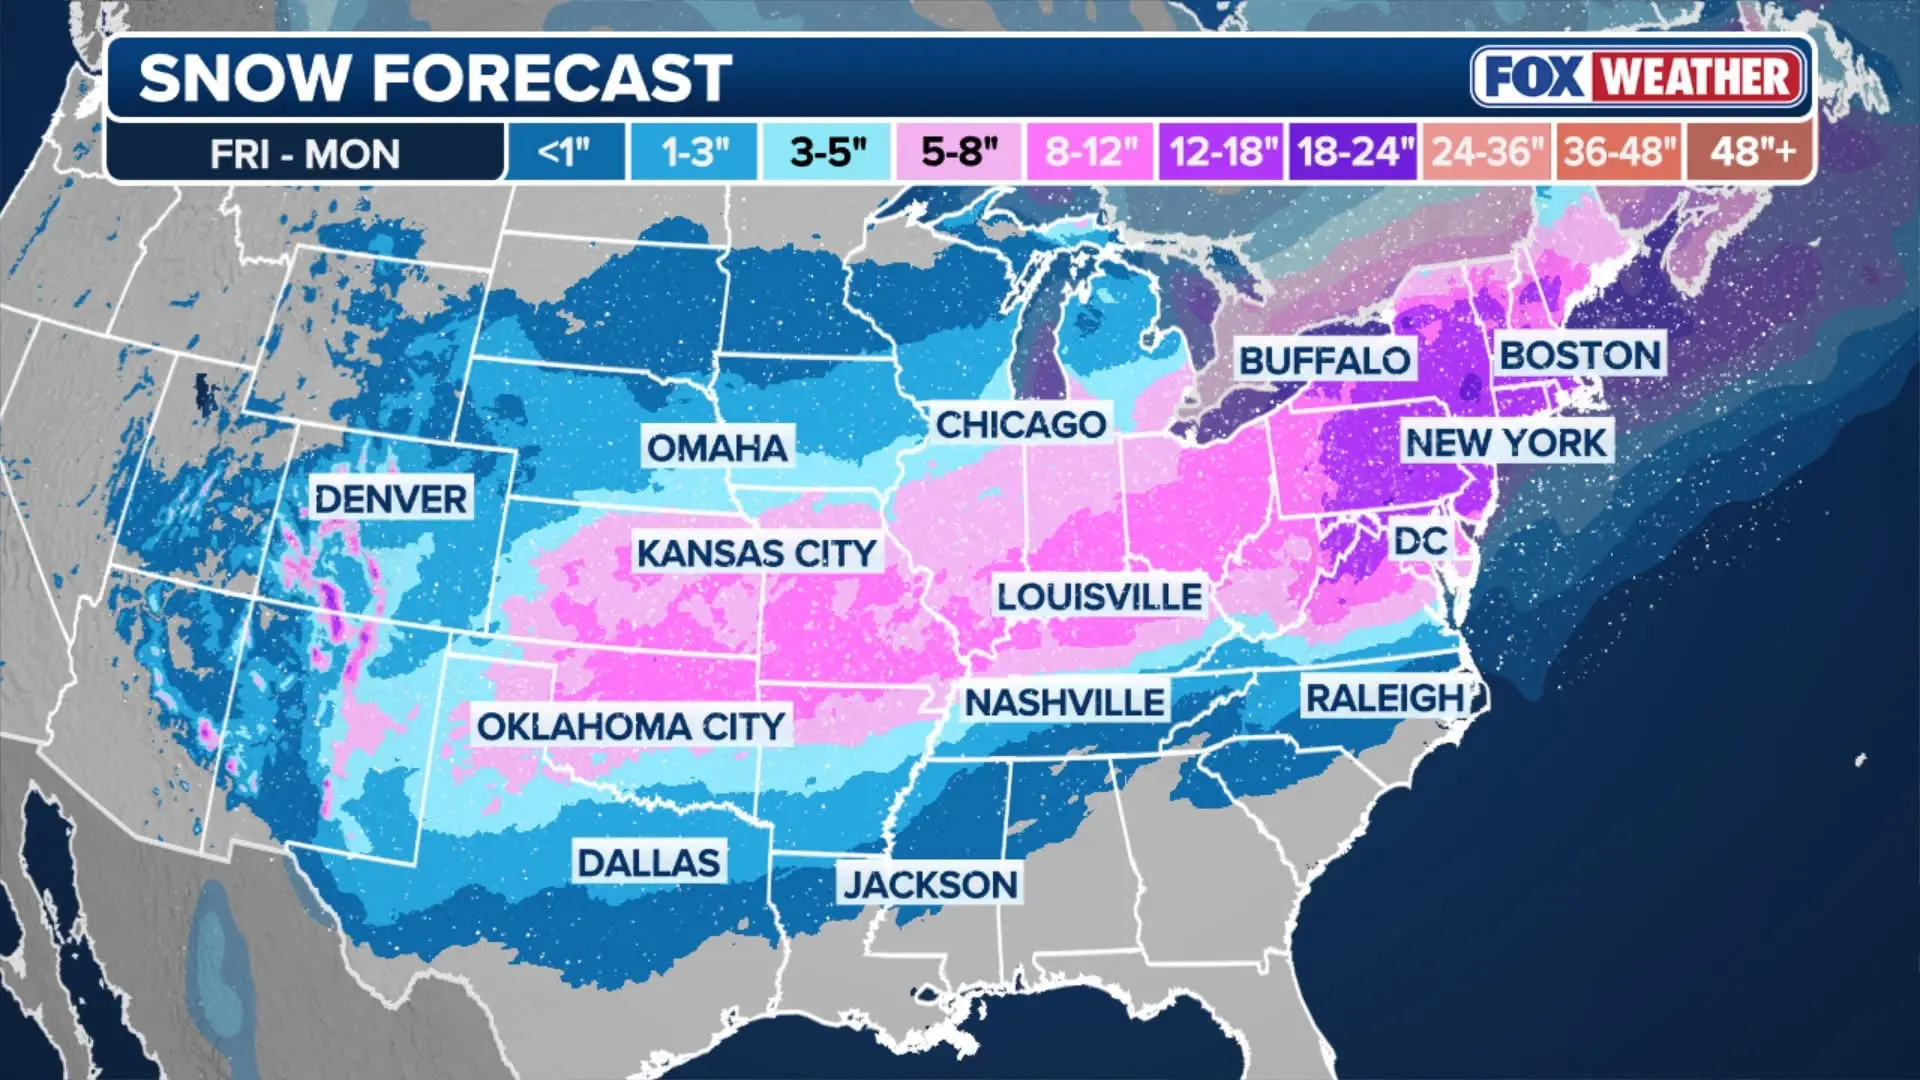
National: The national FOX Weather station published a snow forecast map with slightly more aggressive snow totals compared to other providers. FOX Weather’s map suggested a more northerly approach for the storm system, unlike most others.
Central U.S.: FOX Weather’s forecast for New Mexico and northern Texas performed fairly well, with the exception of slightly too high snow totals in the far NW Texas panhandle. They predicted an area of 8-12” of snow across northern Oklahoma, southern Kansas, far northern Arkansas, and a good portion of Missouri. This forecast did materialize in portions of Oklahoma, northern Arkansas, and a couple areas in southern Missouri. However, for the most part, the region saw 5-10”.
Midwest: In the Midwest, FOX Weather had a good handle on the snow predictions. 8-12” of snow was forecasted for the southern half of Illinois and Indiana, as well as the majority of Ohio. These areas did largely receive 8-12” of snow, with some places seeing a little over a foot of snow. FOX Weather did overestimate the amount of snow in northern Illinois, but nailed the forecast in northern Indiana and the remainder of Ohio. In Kentucky, FOX Weather overestimated snow totals like almost every other provider.
Northeast: FOX Weather published a bold prediction of 12-18” of snow from the West Virginia/Virginia border, through Pennsylvania and New Jersey, and up through the New England area. They even had a small area of 18-24” of snow in southern New York. Numerous areas within the 12-18” map contour did experience more than a foot of snow. Overall, FOX Weather’s forecast for the Northeast performed well.
WeatherBug:
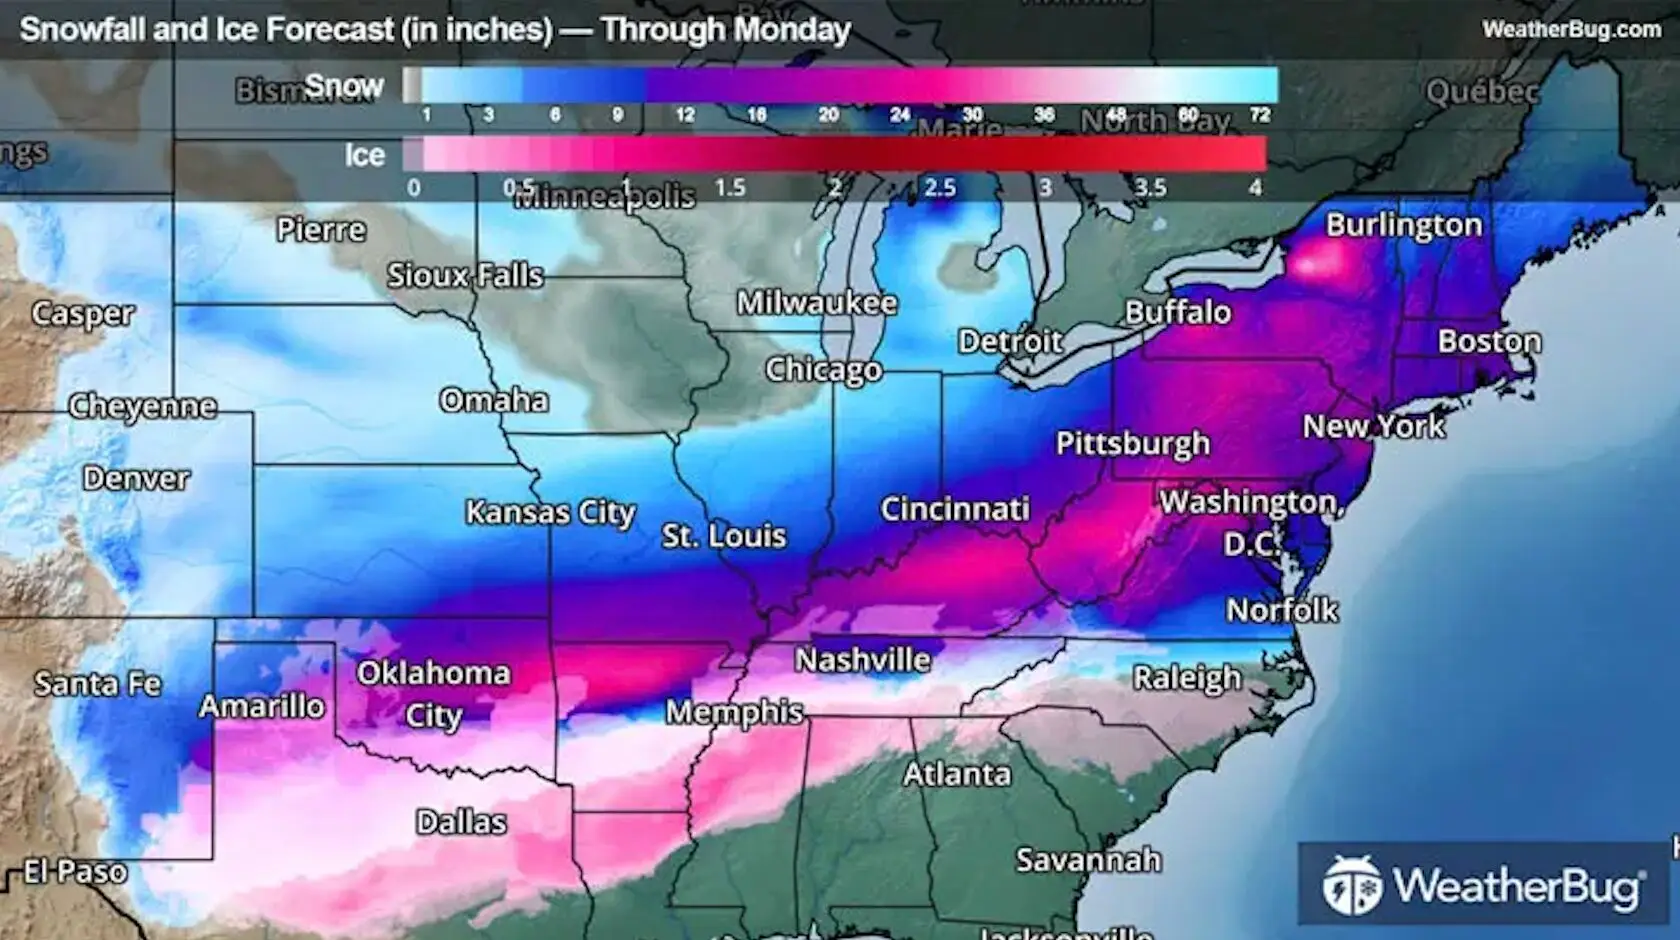
National: This map is a little difficult to read because it blends the ice and snow forecasts together, and they use similar color scales. WeatherBug’s forecast map leans toward the earlier, southern solution.
Central U.S.: Unfortunately, with the ice forecast overlaid on top of the snow forecast in the Central U.S., it is difficult to decipher the forecast in some places. It appears that their forecast for New Mexico shows less than 10” of snow, but also shows snow more widespread than what actually occurred. It is nearly impossible to decipher what the snow forecast was for the Texas panhandle, so we will refrain from judgement there. Across Oklahoma and into northern Arkansas WeatherBug’s forecast called for more than a foot of snow. There were a couple select areas that did receive a foot, but for the most part reports were in the 6-10” range. The snowfall predictions for Kansas and Missouri were generally good.
Midwest: WeatherBug’s snow forecast for the Midwest was generally 50-100 miles too far south. Snow observations in central and northern Illinois and Indiana were higher than forecasted. The forecast in Ohio also slightly underestimated the snow. On the other hand, snow observations in Kentucky were much lower than forecasted.
Northeast: Due to the color gradient and scale used on the map, it is a little difficult to decipher where exactly the totals match on the map. However, WeatherBug’s snow forecast for the Northeast generally suggests 12-16+ inches for much of the region. Numerous locations across this region reported totals within that range, and in some cases exceeding the range. Snow totals were likely overestimated by WeatherBug in locations in West Virginia, Maryland, and southern New York. WeatherBug potentially underestimated snowfall totals in the New England area, where more than a foot of snow fell, and in some cases a foot and a half.
…
Of course, there are many factors that can contribute to snowfall forecasts verifying or not. The exact path that the low pressure system takes can greatly affect where the sharp cutoff in totals may be. Sometimes a 20 mile difference can be the difference between no snow and 8” of snow. Surface temperatures and atmospheric temperatures also play a role in the type of precipitation that falls. Where lighter, fluffier snow falls, especially if there is wind causing blowing and drifting, it is more difficult to obtain accurate reports.
The ForecastWatch suite of solutions offers a variety of ways to better understand the value and quality of weather forecasts to meet the needs of meteorologists, corporate clients, and media partners. If you could benefit from our accuracy data and analysis, contact us today at info@forecastwatch.com.
