We’ve got another round of enhancements in ForecastWatch. Login now to begin to use them.
Cleaner scores, sharper diagnostics
An accuracy benchmark is only as good as the observations behind it and the peers it measures you against. This release tightens both – and brings back the diagnostics you missed.
Scores that reflect real weather, not broken equipment
Stuck sensors no longer contaminate your scores. When a temperature sensor flatlines for twelve-plus hours on an implausible value – outside climate normals, or steady in a climate that should swing – those hours are removed before scoring and thin days are invalidated. Genuinely steady climates (a tropical station holding 27°C overnight) never trigger it. Persistent failures are caught within the day, logged to the station’s audit trail, and we’ve already swept and corrected historical data carrying the same signature.
“Best in market” now means a provider that actually competed. Best-in-market, percentile rank, and gap-to-best are computed only from providers with real coverage in the slice you’re viewing — a sample comparable to the rest of the market for the month, and valid data every day of a range like days 10–14. In May 2026, the US day-14 high-temperature “best” had been set by 43 forecasts against 26,000+ for full-coverage providers. That doesn’t happen anymore, and a retroactive sweep corrects historical benchmarks everywhere. Your own accuracy data is untouched wherever your coverage is real.
Horizons match what your feed delivers. Sixteen providers – mostly NWP feeds like GFS, ECMWF, ICON, and GEM – were configured a day or more past their last fully covered local day, which never produces a valid score. Each horizon now ends where the data does, so day-out pickers and multi-day benchmarks stop offering ranges with nothing behind them.
Diagnostics and data you asked for
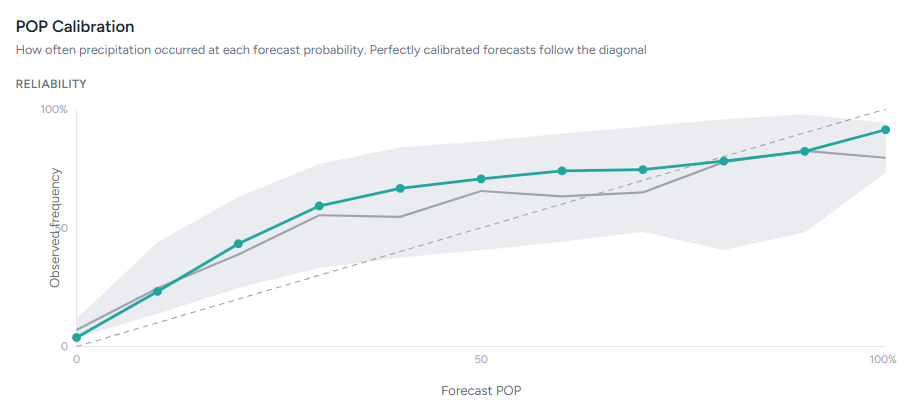
POP Calibration is back. Select 24h POP in Monthly Insights for a reliability diagram across all eleven bins: your curve against a pooled market curve, an anonymous market-range band, and the perfect-calibration diagonal — plus a commitment histogram and exact per-bin counts. The band only draws where at least two other providers clear 100 forecasts in a bin, so its width reflects real calibration spread, never sampling noise or any single competitor. It’s the legacy occurrence-frequency view – the first measure our own methodology says to read for POP – rebuilt privacy-safe.
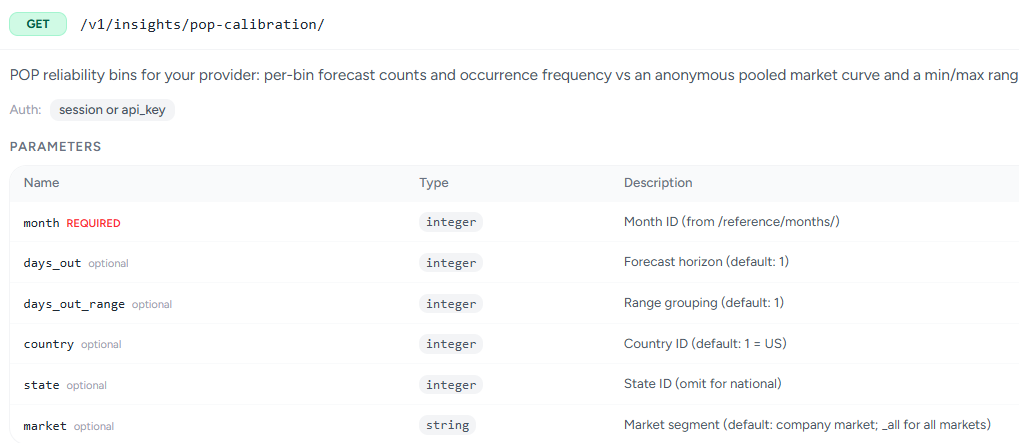
And it’s on the API. GET /v1/insights/pop-calibration/ returns the same per-bin counts, observed and market frequencies, and Brier/BSS figures, on the same month, days-out, location, and market parameters as the other insights endpoints. We’ve also documented GET /v1/reference/stations/{code}/ for deterministic ICAO/SYNOP code-to-id lookups.
MOS Overview returns to Data Export – station level, in CSV and Excel – with twelve columns per station covering temperature and precipitation counts, RMS errors, within-3°F rates, and percent-correct, alongside the usual Summary, States, and Data Dictionary sheets. Report PDFs now show their sharing license before you download: a green “Shareable” or amber “Watermarked sample” chip on report cards, in the Export Summary, and in My Exports. ForecastWatch data is always shareable inside your own organization; the chip reflects your Sales & Marketing License, which covers sharing externally under NDA.