The Inaugural 2026 ForecastWatch “Most Accurate Forecast Awards” are Live!
Ship model upgrades with proof, not hope. Every model change is a bet that the new version beats the one already in production. Feed Analysis scores your development feed against your production feed on the same stations, the same period, and the same methodology. You see exactly where the new model wins, where it regresses, and what still needs work before it goes live.
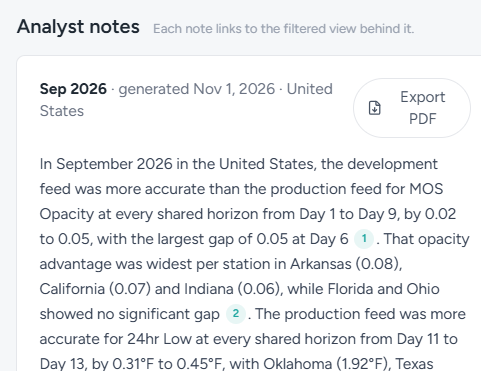
Know what changed and why, before you ship it. Every month, Feed Analysis writes a plain-language summary of how your development feed performed against production. It covers where the new model wins, where it regresses, and which states and stations drive the gap. Each finding links straight to the filtered view behind it, and the full set of notes exports to PDF for your release review.
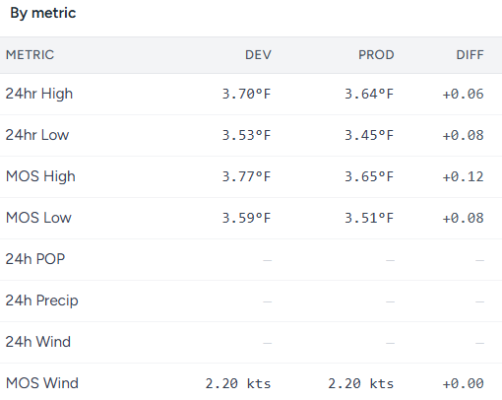
See the verdict for every metric on one screen. Snapshot tables put the development and production feeds side by side across all core variables, from 24hr High/Low to MOS Wind and Opacity. One table shows average error and how many shared horizons the development feed wins. A second table maps better, worse, or within tolerance for every metric at every lead day. Regressions are visible in seconds instead of hours
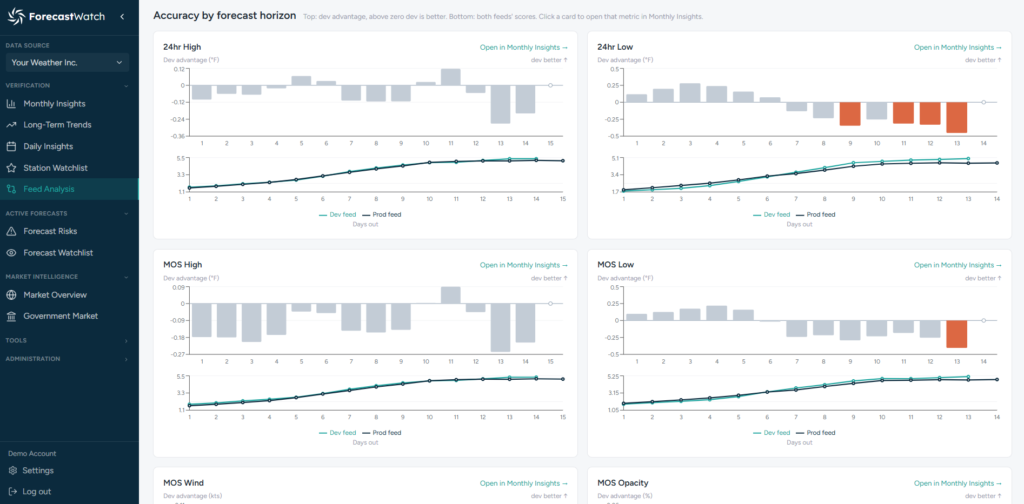
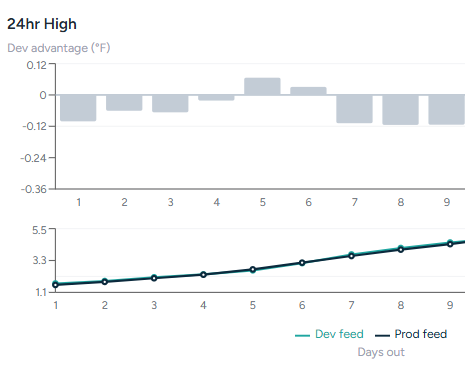
Find exactly where in the forecast window your model breaks down. A model change can sharpen Day 1 and degrade Day 10. For each metric, Feed Analysis charts the development feed’s advantage at every lead day. It sits above both feeds’ error curves, and gains and losses beyond tolerance are highlighted. Click any chart to open that metric in Monthly Insights for station-level detail.
It compares a development or alternate version of your forecast against your current production feed. Both feeds are scored over the same period, the same stations, and the same shared forecast horizons, using ForecastWatch’s published verification methodology. The result is an apples-to-apples read on whether a model change is ready for release.

Each metric has its own tolerance. When the difference between the two feeds at a given horizon falls inside that tolerance, the result is marked “Same.” Only gaps beyond tolerance count as a win for either feed. This keeps small, noisy differences from being reported as real improvements or regressions.
Yes. The Analyst Notes export to PDF, so they can go straight into a model release review or a leadership update. Every note and chart also links into Monthly Insights for anyone who wants to check the underlying station-level data.
This site uses cookies to improve your experience. See our Privacy Policy.